Fig. 3.
Download original image
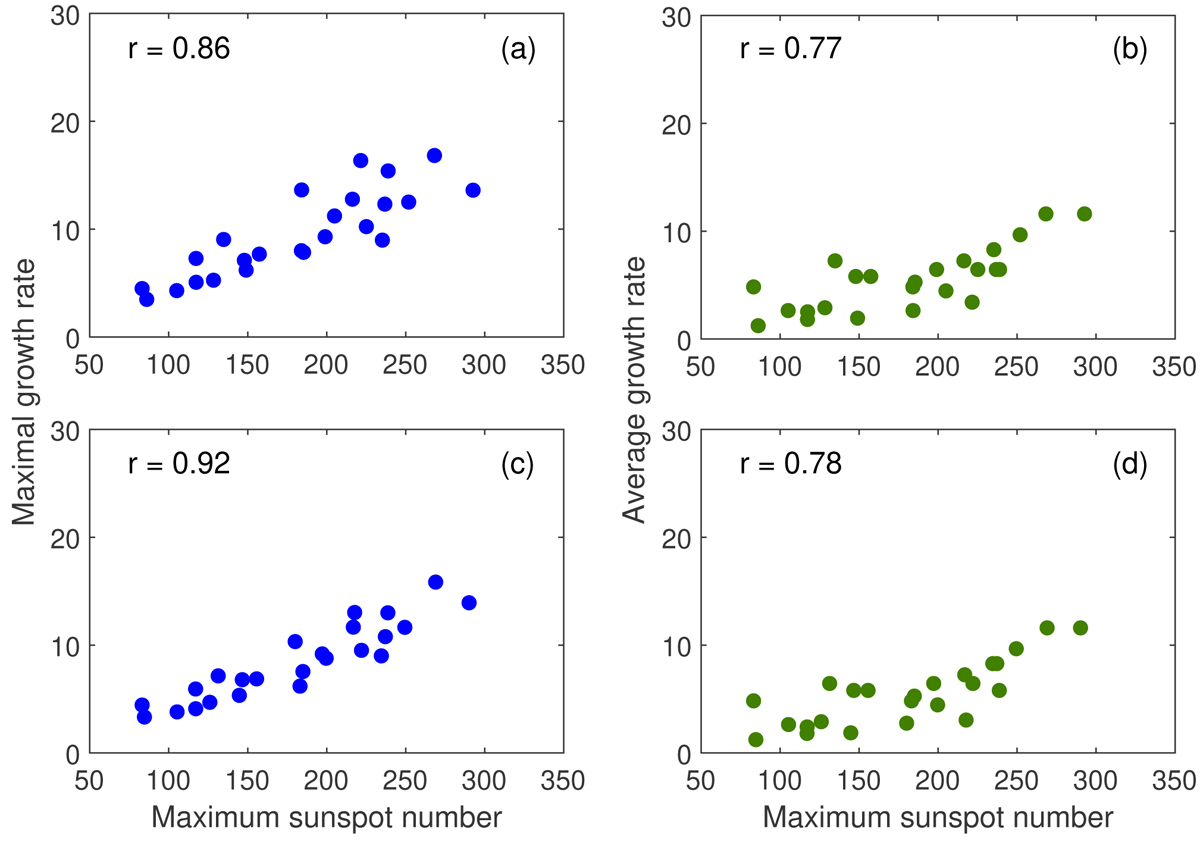
Relation between the growth rate indicators and the amplitudes of solar cycles 1–24. Left panels a and c: maximal growth rate (SNFD peaks). Right panels b and d: average growth rate. Top panels a and b: 13-month optimised running-mean. Bottom panels c and d: 37-month optimised running mean. The numbers indicate the solar cycle number.
Current usage metrics show cumulative count of Article Views (full-text article views including HTML views, PDF and ePub downloads, according to the available data) and Abstracts Views on Vision4Press platform.
Data correspond to usage on the plateform after 2015. The current usage metrics is available 48-96 hours after online publication and is updated daily on week days.
Initial download of the metrics may take a while.