Fig. 6
Download original image
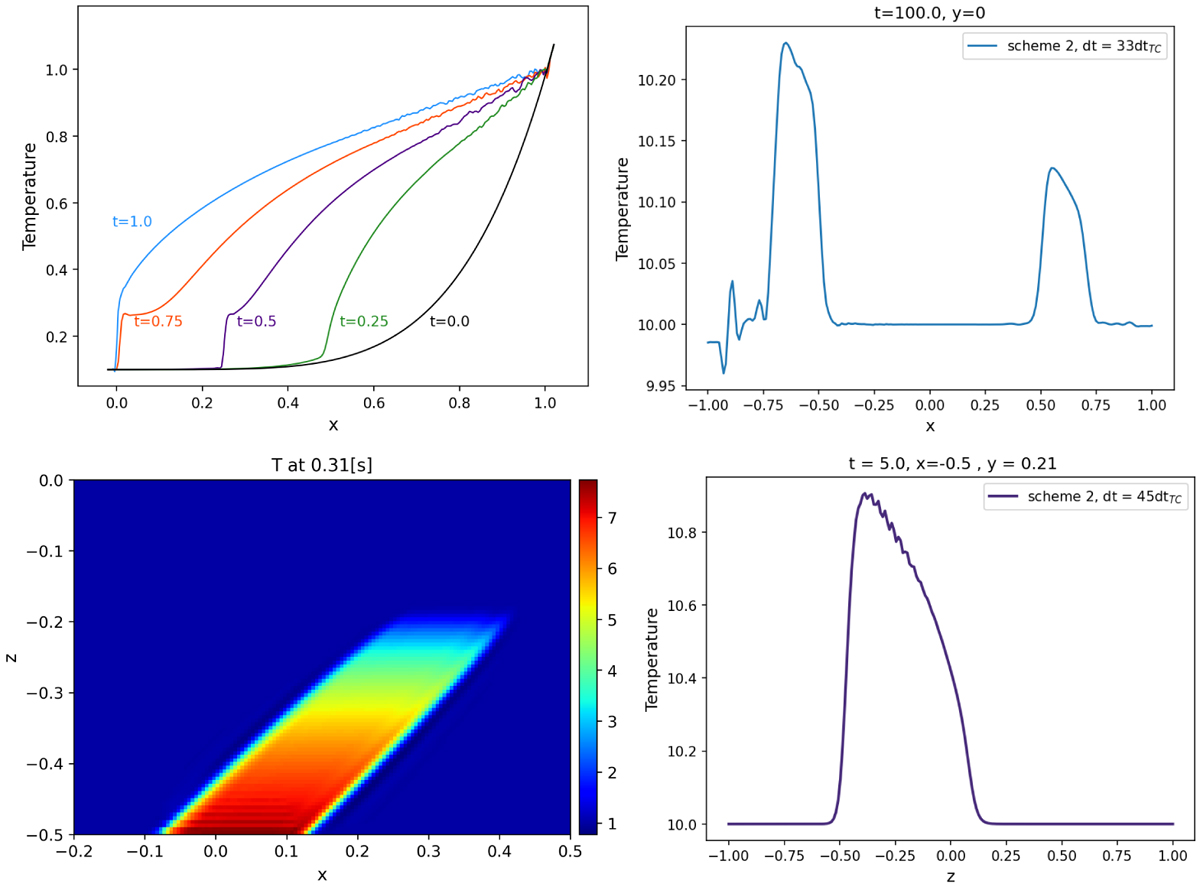
Unstable examples of the tests using scheme #2 with time steps beyond the stability limit. Top left shows the temperature evolution in the one-dimensional test with dt = 200dtTC. Top right presents a temperature colormap for the static ring problem using dt = 33dtTC and t = 100. The bottom left panel shows a temperature colormap of the temperature for the hotplate test, using a time step dt = 500dttc. Bottom right panel shows a contour of temperature in the three-dimensional static ring problem in an early stage, t = 5 s, using a time step dt = 45dttc.
Current usage metrics show cumulative count of Article Views (full-text article views including HTML views, PDF and ePub downloads, according to the available data) and Abstracts Views on Vision4Press platform.
Data correspond to usage on the plateform after 2015. The current usage metrics is available 48-96 hours after online publication and is updated daily on week days.
Initial download of the metrics may take a while.