Fig. 5
Download original image
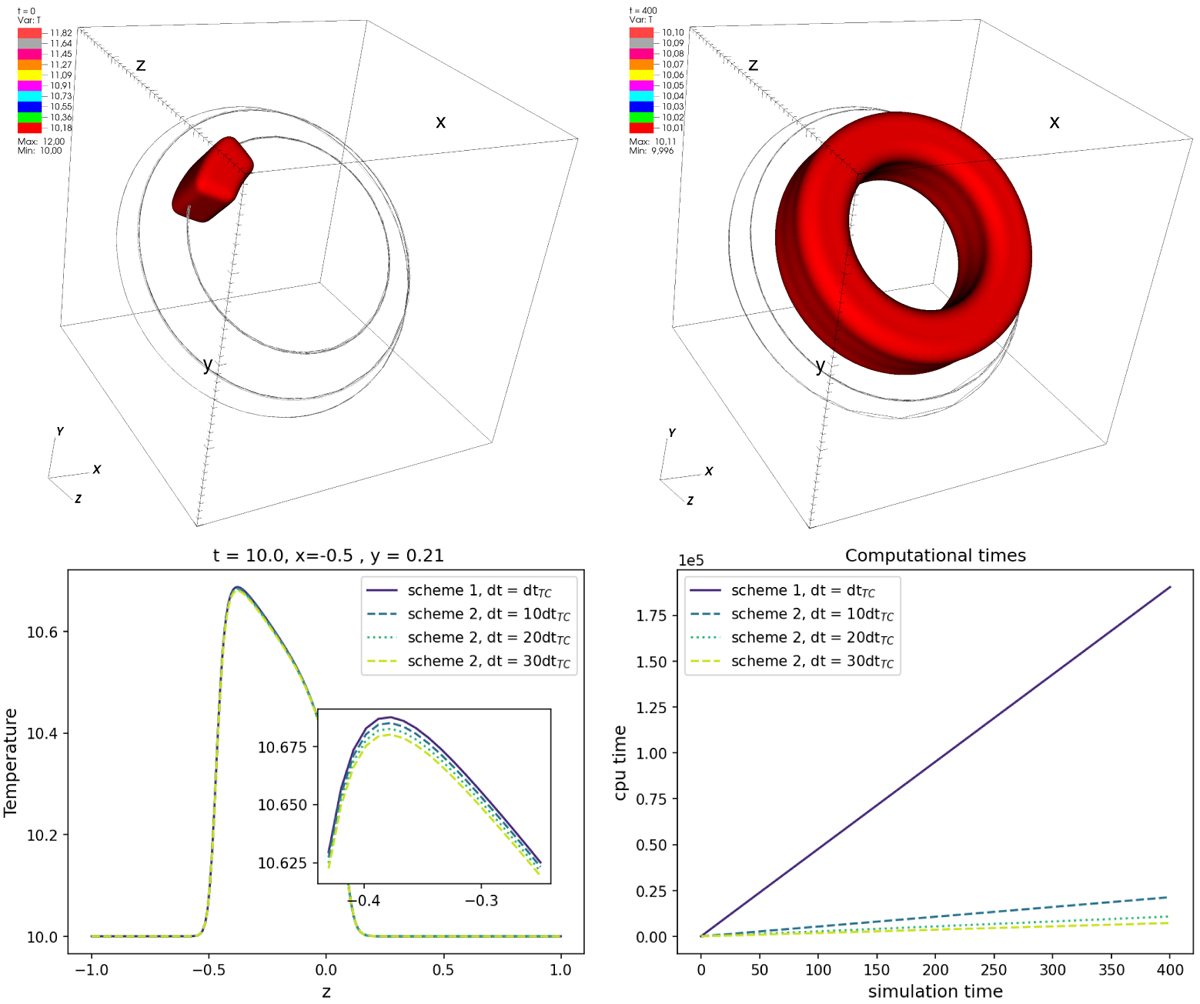
Results for the three-dimensional static ring problem. The top panels correspond to the contour of temperature at the initial and final stages, together with the magnetic field lines, obtained with the simulation with scheme #1. Bottom left panel shows a comparison of one snapshot of the temperature at x = −0.5 and y = 0.21 at t = 10 for different simulations using scheme #2 and different time steps. In the bottom right panel, a graphical representation of the computational times of the different runs is given.
Current usage metrics show cumulative count of Article Views (full-text article views including HTML views, PDF and ePub downloads, according to the available data) and Abstracts Views on Vision4Press platform.
Data correspond to usage on the plateform after 2015. The current usage metrics is available 48-96 hours after online publication and is updated daily on week days.
Initial download of the metrics may take a while.