Fig. 3
Download original image
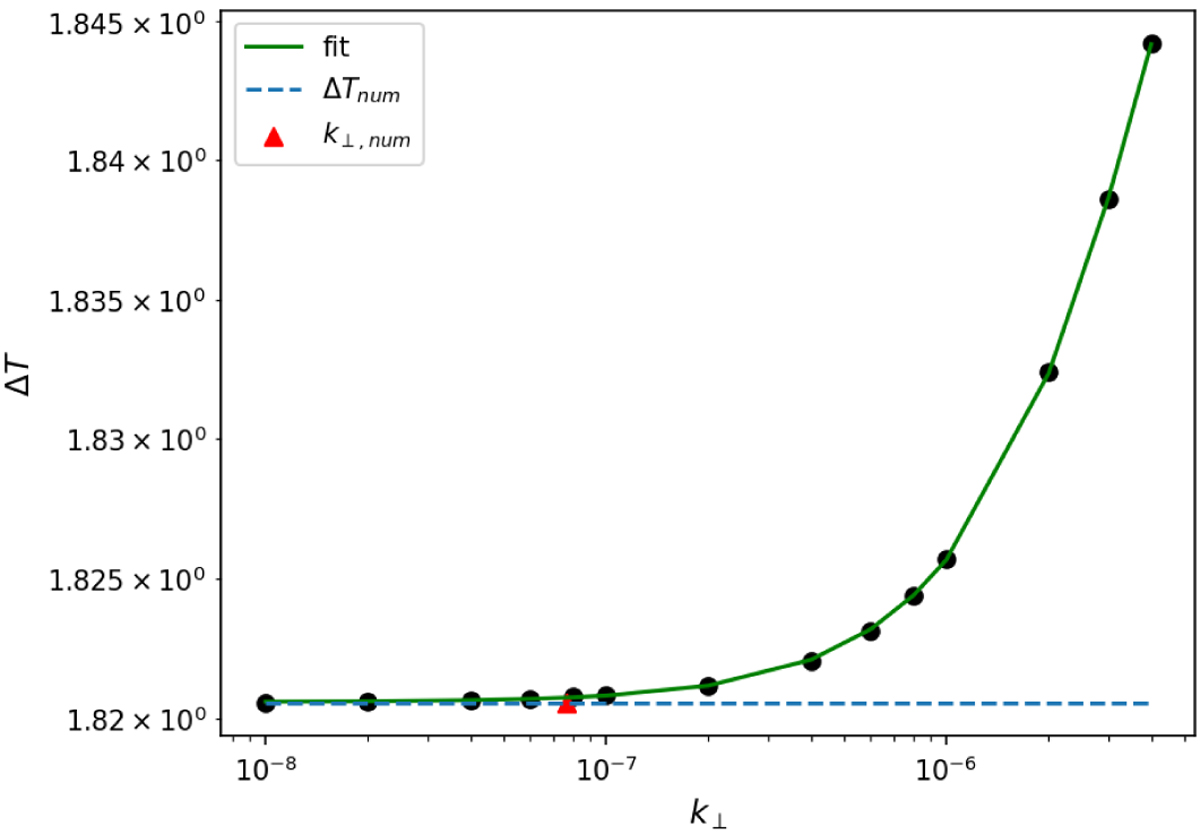
Graphical representation of the method used to calculate the numerical perpendicular conductivity. The dots represent the final maximum temperature minus initial maximum temperature (∆T) in the simulations with different values of k⊥ shown at the horizontal axis. The dashed line is the difference of temperature (∆Tnum) in the simulation with κ⊥ = 0. We fit the data to a hyperbolic tangent function (solid line). The numerical perpendicular conduction coefficient к⊥,num is estimated by locating the position where the first derivative of the fit is 100 times smaller than its maximum value.
Current usage metrics show cumulative count of Article Views (full-text article views including HTML views, PDF and ePub downloads, according to the available data) and Abstracts Views on Vision4Press platform.
Data correspond to usage on the plateform after 2015. The current usage metrics is available 48-96 hours after online publication and is updated daily on week days.
Initial download of the metrics may take a while.