Fig. 2
Download original image
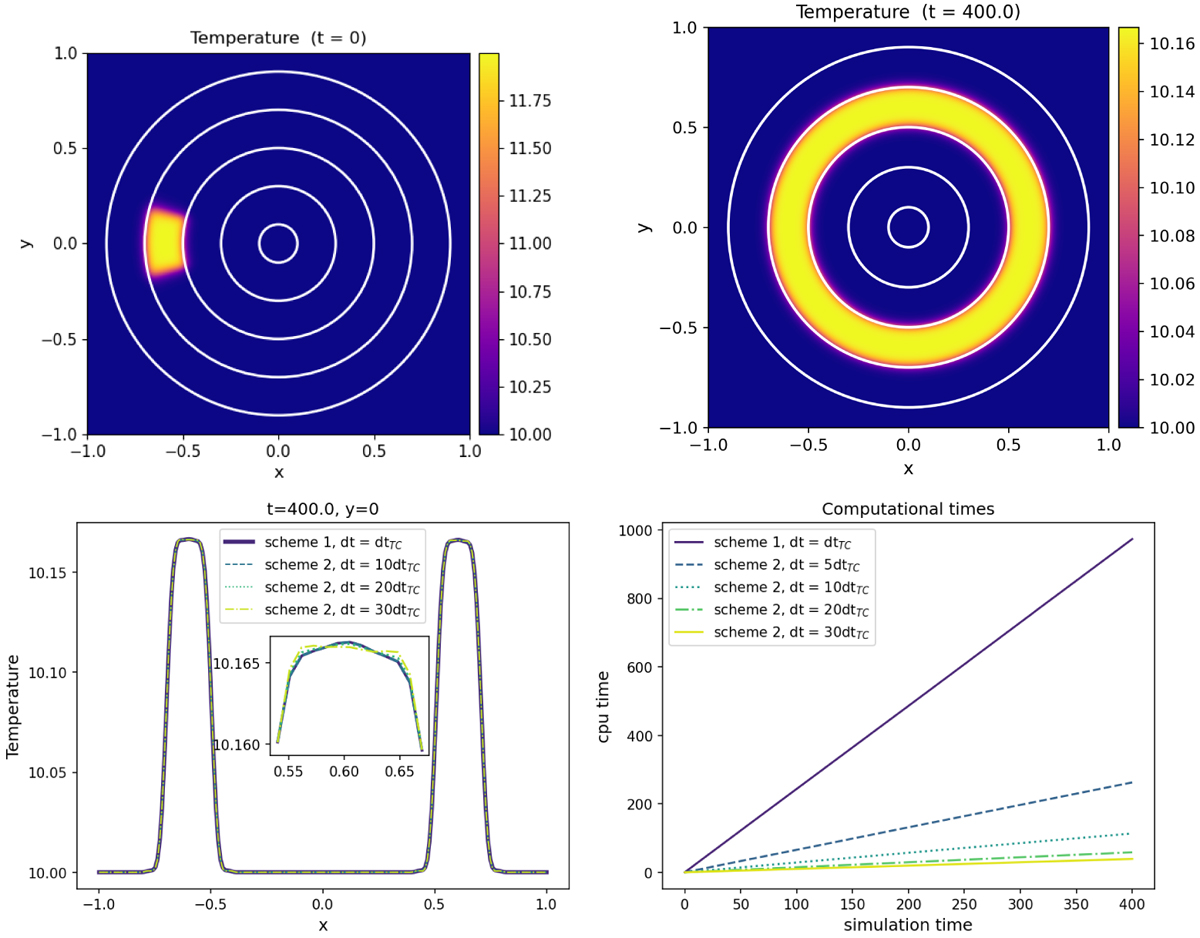
Two-dimensional static ring problem. Top panels show colormaps of the temperature and magnetic field lines at the initial and final states. The bottom left panel shows a comparison of the temperature at y = 0 between the different simulations at the final stage. Bottom right panel gives a graphical representation of the computational times.
Current usage metrics show cumulative count of Article Views (full-text article views including HTML views, PDF and ePub downloads, according to the available data) and Abstracts Views on Vision4Press platform.
Data correspond to usage on the plateform after 2015. The current usage metrics is available 48-96 hours after online publication and is updated daily on week days.
Initial download of the metrics may take a while.