Fig. 1
Download original image
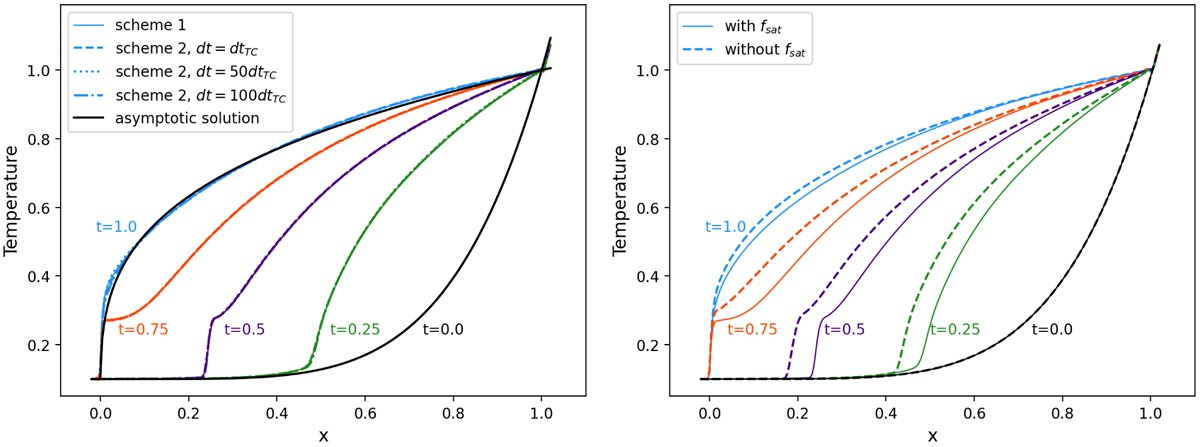
Left panel shows the evolution of temperature in the one-dimensional thermal conductivity test computed with the scheme #1 (explicit evolution of the parabolic term) and with the scheme #2 (hyperbolic equation for heat flux) with three different time steps. Right panel shows a comparison between simulations using scheme #2, one including the saturation factor of Eq. (11) and another one without it.
Current usage metrics show cumulative count of Article Views (full-text article views including HTML views, PDF and ePub downloads, according to the available data) and Abstracts Views on Vision4Press platform.
Data correspond to usage on the plateform after 2015. The current usage metrics is available 48-96 hours after online publication and is updated daily on week days.
Initial download of the metrics may take a while.