Fig. 4.
Download original image
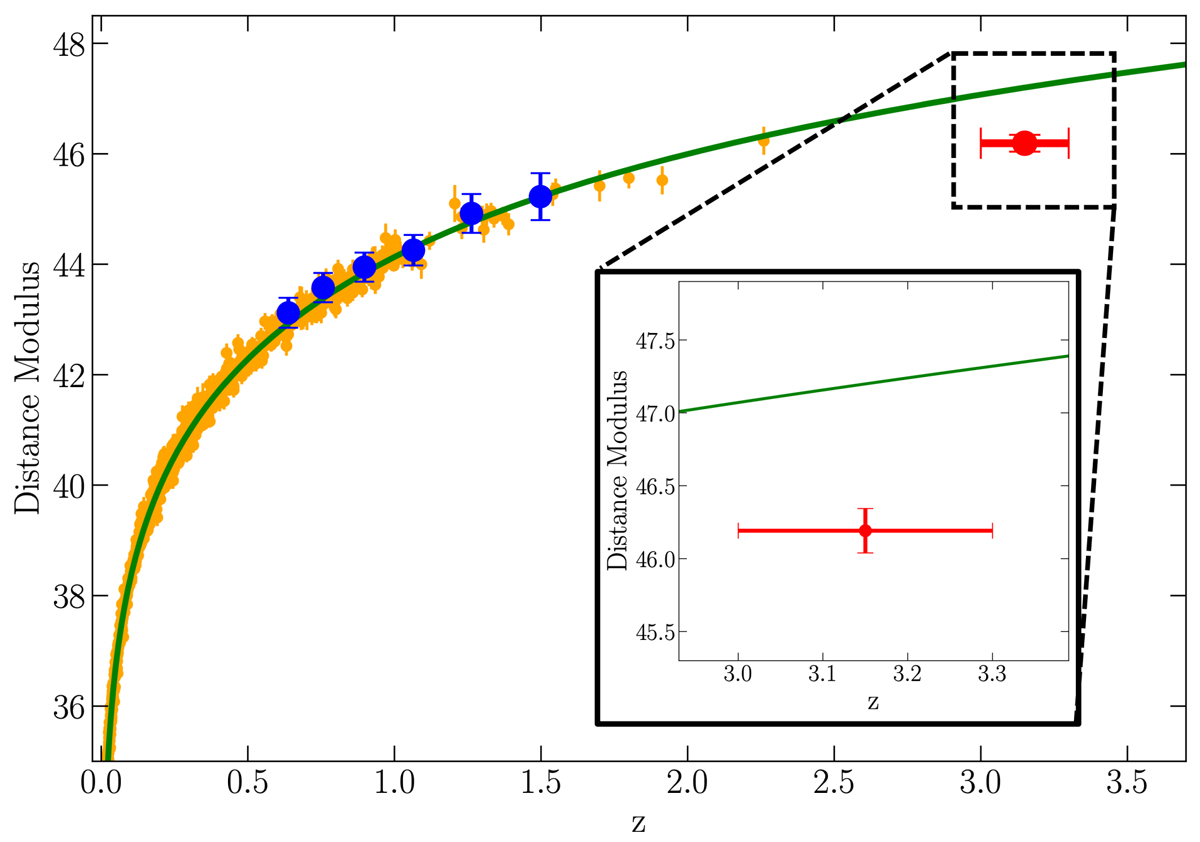
Hubble diagram of Pantheon supernovae (orange points, Scolnic et al. 2018), quasars at redshifts z = 0.7–1.3 (blue points), and quasars at redshifts z = 3.0–3.3 (red point). The luminosity distances for quasars were calculated using the parameters γ and β as described in the text, i.e., assuming that these parameters do not change with redshift, and adopting the best-fit flat ΛCDM model for supernovae. Each quasar point represents the average for all the quasars in the corresponding redshift interval.
Current usage metrics show cumulative count of Article Views (full-text article views including HTML views, PDF and ePub downloads, according to the available data) and Abstracts Views on Vision4Press platform.
Data correspond to usage on the plateform after 2015. The current usage metrics is available 48-96 hours after online publication and is updated daily on week days.
Initial download of the metrics may take a while.