Open Access
Fig. 1.
Download original image
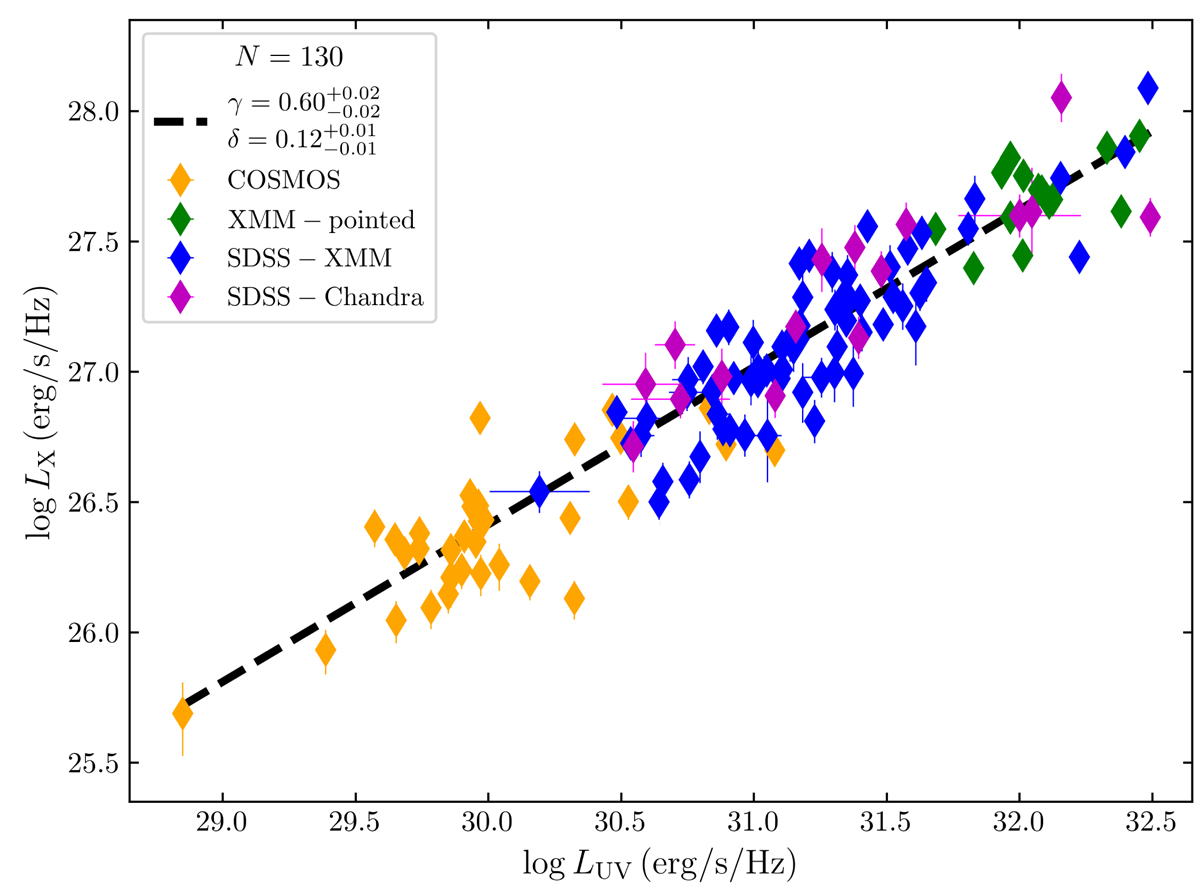
log LX vs. log LUV for the full z > 2.5 sample presented in this work. Colours refer to the different sub-samples, as indicated in the legend. The γ and δ symbols represent the slope and the intrinsic dispersion of the best-fit relation, respectively.
Current usage metrics show cumulative count of Article Views (full-text article views including HTML views, PDF and ePub downloads, according to the available data) and Abstracts Views on Vision4Press platform.
Data correspond to usage on the plateform after 2015. The current usage metrics is available 48-96 hours after online publication and is updated daily on week days.
Initial download of the metrics may take a while.