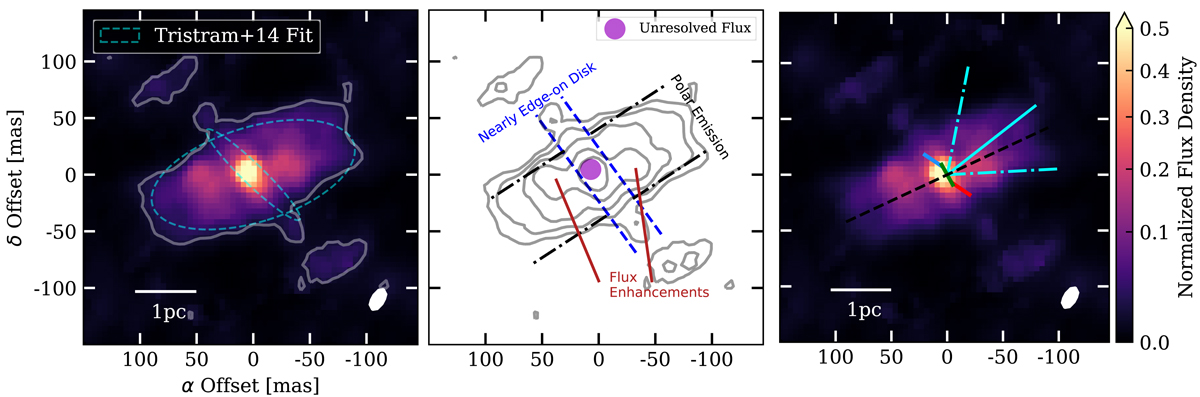
Fig. 4.
Download original image
N-band continuum image and component labels. Left panel: flux-weighted mean MATISSE image – a proxy for an N-band continuum image. Contours are drawn at 5× the flux-weighted mean of the individual image errors. The cyan dashed ellipses represent the FWHM of the Gaussians fitted to MIDI observations of Circinus by T14. Center panel: same image as a contour map with levels at [5, 10, 20, 40, 80]× the 5× the flux-weighted mean of the individual image errors. Key morphological features are labeled: the 1.9 pc disk with i ≳ 83°, the polar emission, and the polar flux enhancement. Right panel: same image with the Greenhill et al. (2003) masers overplotted. The black dashed line represents the direction of the radio jet (Elmouttie et al. 1998). The cyan lines show the central PA and opening angle of the optical ionization cone (Fischer et al. 2013). Pixel scale and field of view are matched in both panels. All images and contours are scaled to the power of 0.65. The FWHM of the beam is shown in the bottom right corner of each panel. North is up and east is to the left.
Current usage metrics show cumulative count of Article Views (full-text article views including HTML views, PDF and ePub downloads, according to the available data) and Abstracts Views on Vision4Press platform.
Data correspond to usage on the plateform after 2015. The current usage metrics is available 48-96 hours after online publication and is updated daily on week days.
Initial download of the metrics may take a while.