Fig. 4
Download original image
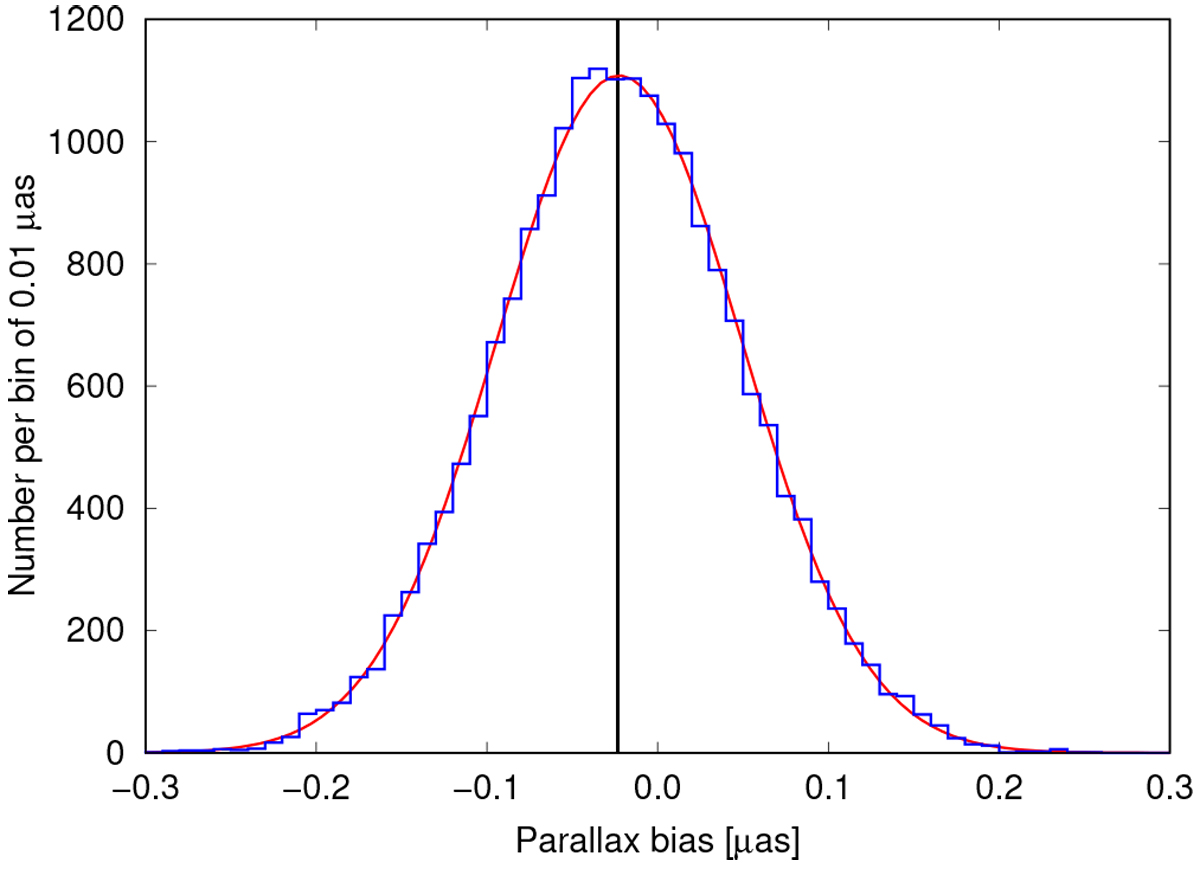
Histogram of the parallax zero point found in 20 000 astrometric solutions for 105 stars using simulated observations with γ − 1 = 10-5. The distribution has a mean of −0.023 μas shown with the vertical solid line, while its standard deviation is 0.072 μas. The red curve is a Gaussian distribution with the same parameters.
Current usage metrics show cumulative count of Article Views (full-text article views including HTML views, PDF and ePub downloads, according to the available data) and Abstracts Views on Vision4Press platform.
Data correspond to usage on the plateform after 2015. The current usage metrics is available 48-96 hours after online publication and is updated daily on week days.
Initial download of the metrics may take a while.