Open Access
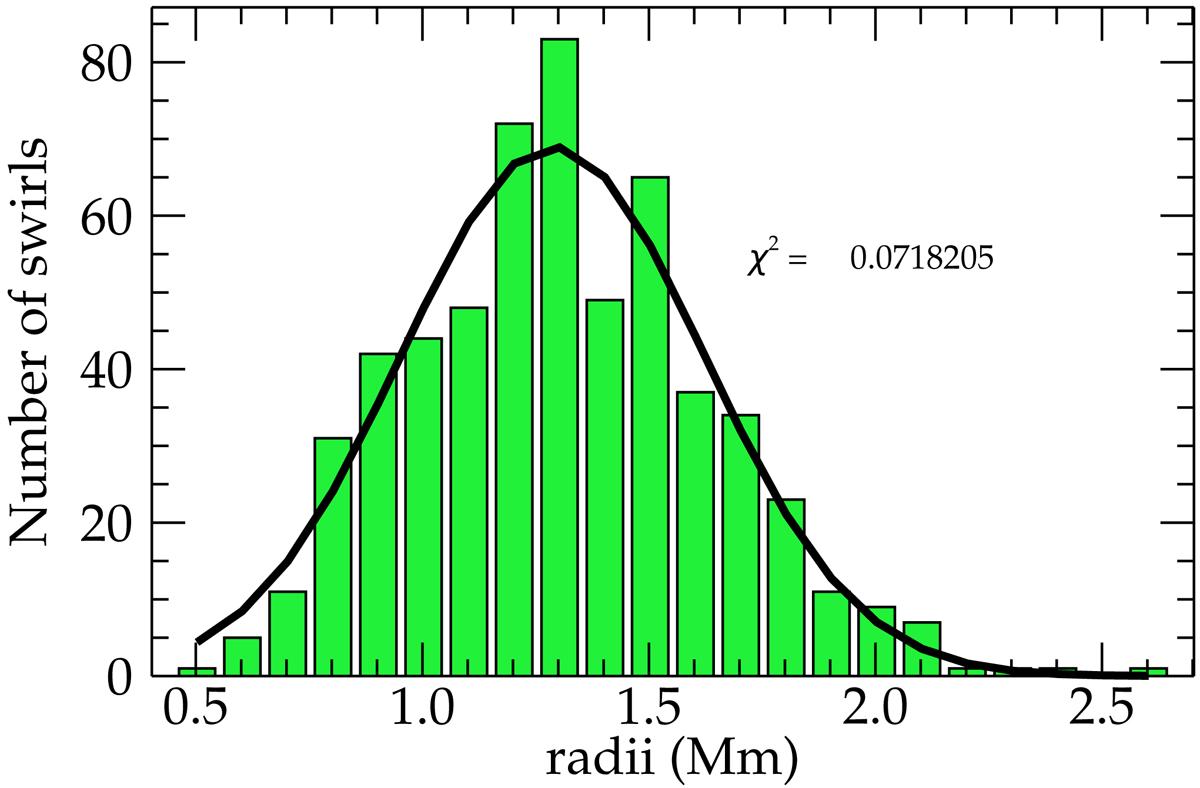
Fig. 7.
Download original image
Histogram of the derived radii of the 577 swirls. The green bars refer to the derived radii (see text), while the overplotted black line represents the curve that fits a Gaussian distribution.
Current usage metrics show cumulative count of Article Views (full-text article views including HTML views, PDF and ePub downloads, according to the available data) and Abstracts Views on Vision4Press platform.
Data correspond to usage on the plateform after 2015. The current usage metrics is available 48-96 hours after online publication and is updated daily on week days.
Initial download of the metrics may take a while.