Open Access
Fig. 6.
Download original image
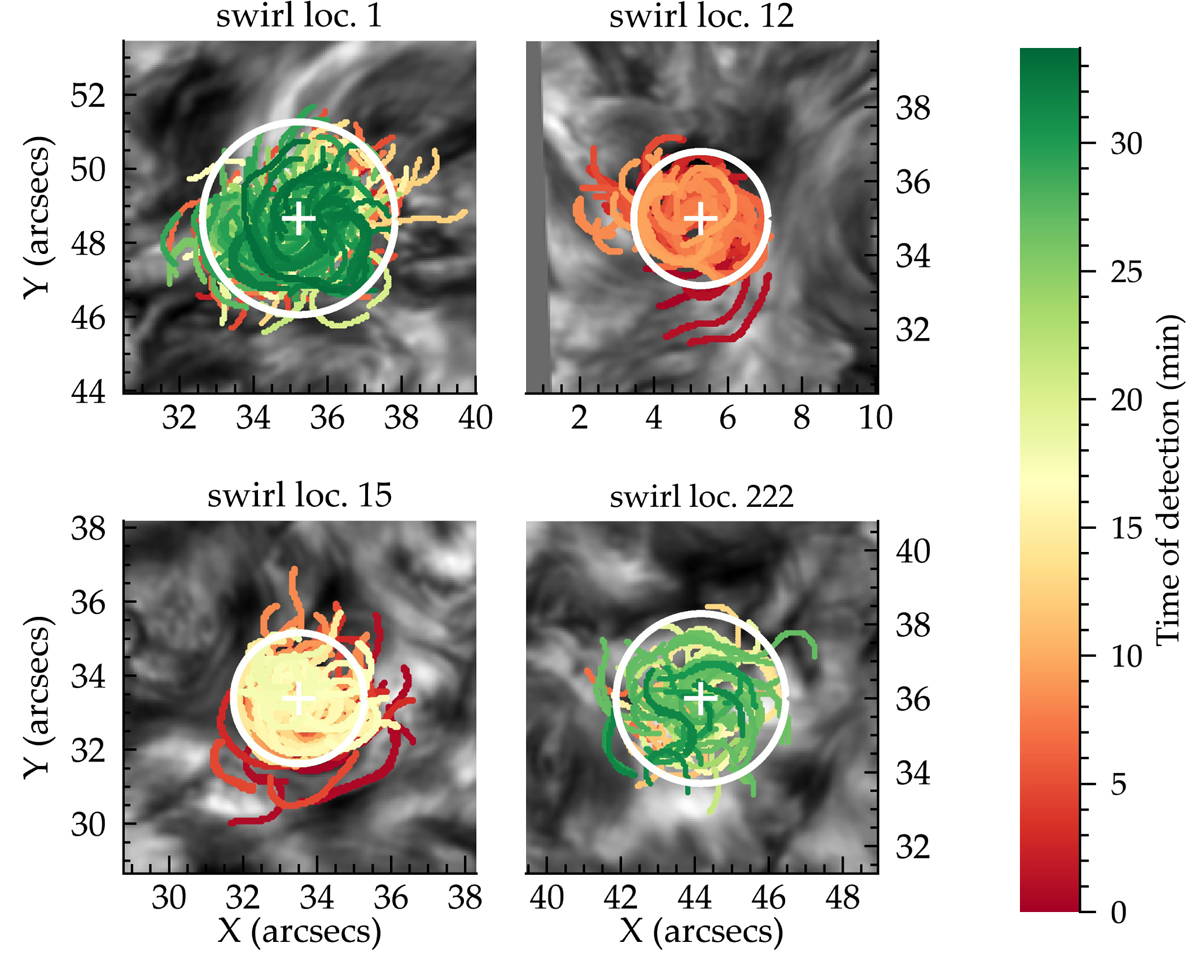
Segments of 4 out of 577 detected chromospheric swirls. The radii are calculated from the 10% most distant segments with respect to the swirl center. The segments are color-coded with a colomap indicating the time of detection.
Current usage metrics show cumulative count of Article Views (full-text article views including HTML views, PDF and ePub downloads, according to the available data) and Abstracts Views on Vision4Press platform.
Data correspond to usage on the plateform after 2015. The current usage metrics is available 48-96 hours after online publication and is updated daily on week days.
Initial download of the metrics may take a while.