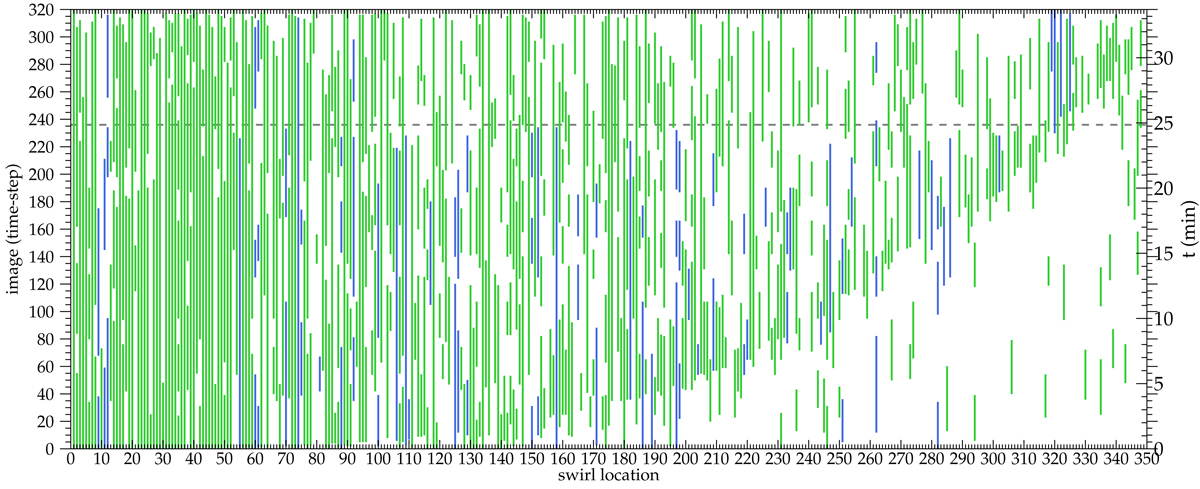
Fig. 5.
Download original image
Temporal evolution of the 577 individual swirls in 350 swirl locations. The horizontal dashed line represents the time of the slight displacement of the FoV (see Fig. 3). The green lines represent the temporal evolution of the 487 out of 577 swirls that lie within the selected common FoV. The blue lines represent the temporal evolution of swirls that cannot be followed through the entire time sequence due to the displacement of the FoV.
Current usage metrics show cumulative count of Article Views (full-text article views including HTML views, PDF and ePub downloads, according to the available data) and Abstracts Views on Vision4Press platform.
Data correspond to usage on the plateform after 2015. The current usage metrics is available 48-96 hours after online publication and is updated daily on week days.
Initial download of the metrics may take a while.