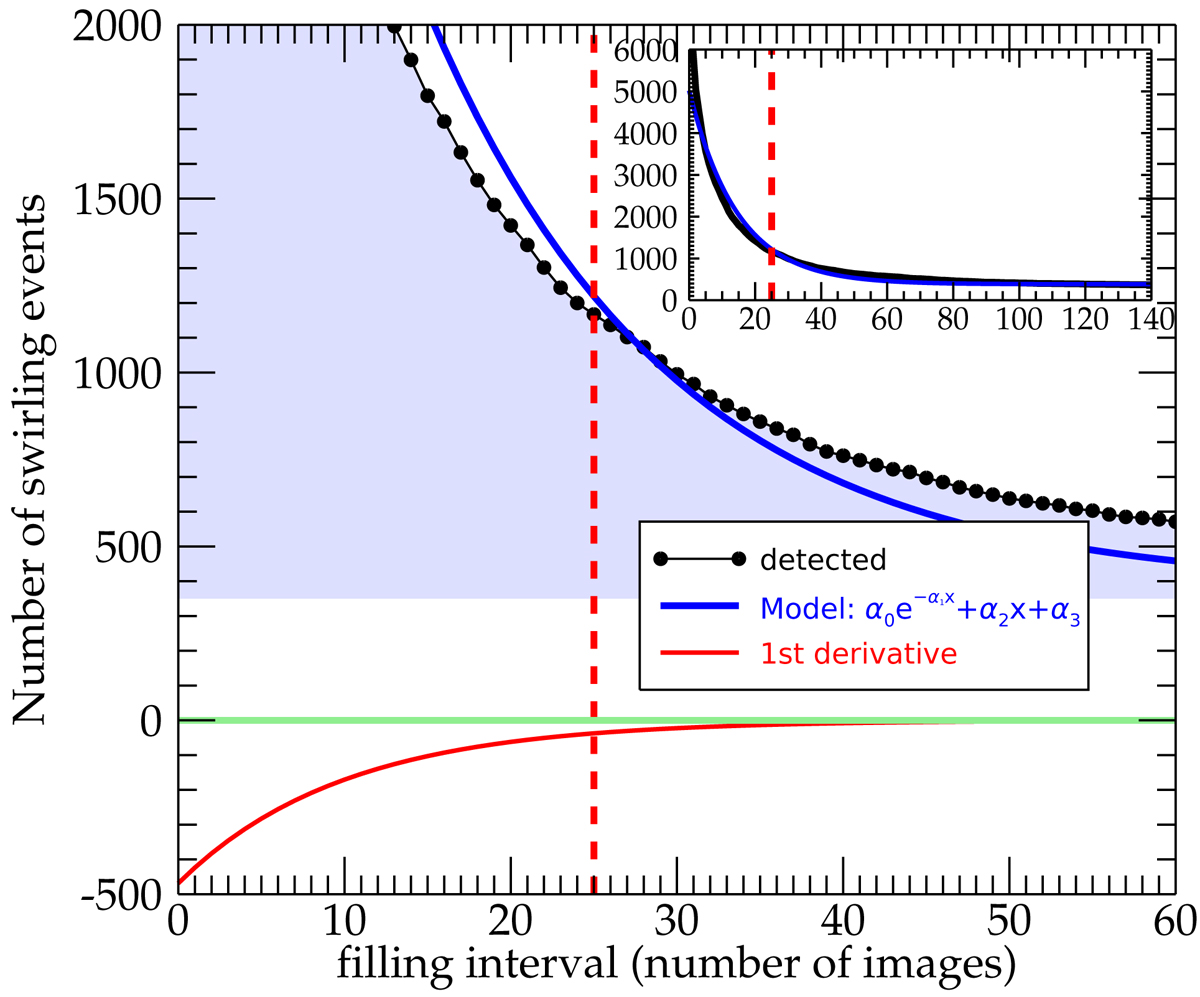
Fig. 4.
Download original image
Number of detected swirling events after the application of the second level clustering vs. the number of gap-filling frames. In the inset figure, we show that the total number of detected swirling events decreases abruptly with the number of frames and finally converges to a constant value. At the zoom-in of the inset figure the fitting curve (blue line) of the detected one is plotted (black line) as well as its first derivative (red line). The dashed line shows the estimated number of the gap-filling frames. The lower border of the shaded area shows that the number of detected swirling events naturally converges to a number of 350 swirls that is equal to the derived locations when all gaps are filled in thanks to the respective large filling intervals.
Current usage metrics show cumulative count of Article Views (full-text article views including HTML views, PDF and ePub downloads, according to the available data) and Abstracts Views on Vision4Press platform.
Data correspond to usage on the plateform after 2015. The current usage metrics is available 48-96 hours after online publication and is updated daily on week days.
Initial download of the metrics may take a while.