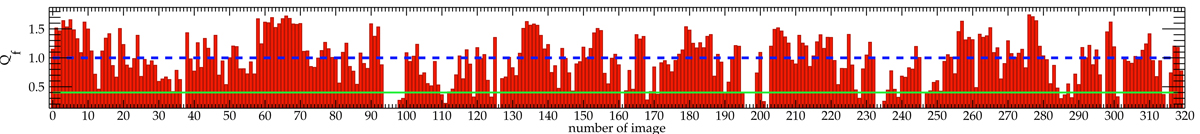
Fig. 2.
Download original image
Barplot of the Qf values of the images of the Hα-0.2 Å dataseries. The horizontal dashed blue line corresponds to images with a ratio of Qf = 1, namely, images with the mean quality. Images with Qf less than 0.4 were considered as highly blurred and were removed. This threshold is marked by the horizontal light green line. The gaps in the plot correspond to a total number of 21 removed images from the initial pipeline (16 images) and the application of the above threshold (five more images).
Current usage metrics show cumulative count of Article Views (full-text article views including HTML views, PDF and ePub downloads, according to the available data) and Abstracts Views on Vision4Press platform.
Data correspond to usage on the plateform after 2015. The current usage metrics is available 48-96 hours after online publication and is updated daily on week days.
Initial download of the metrics may take a while.