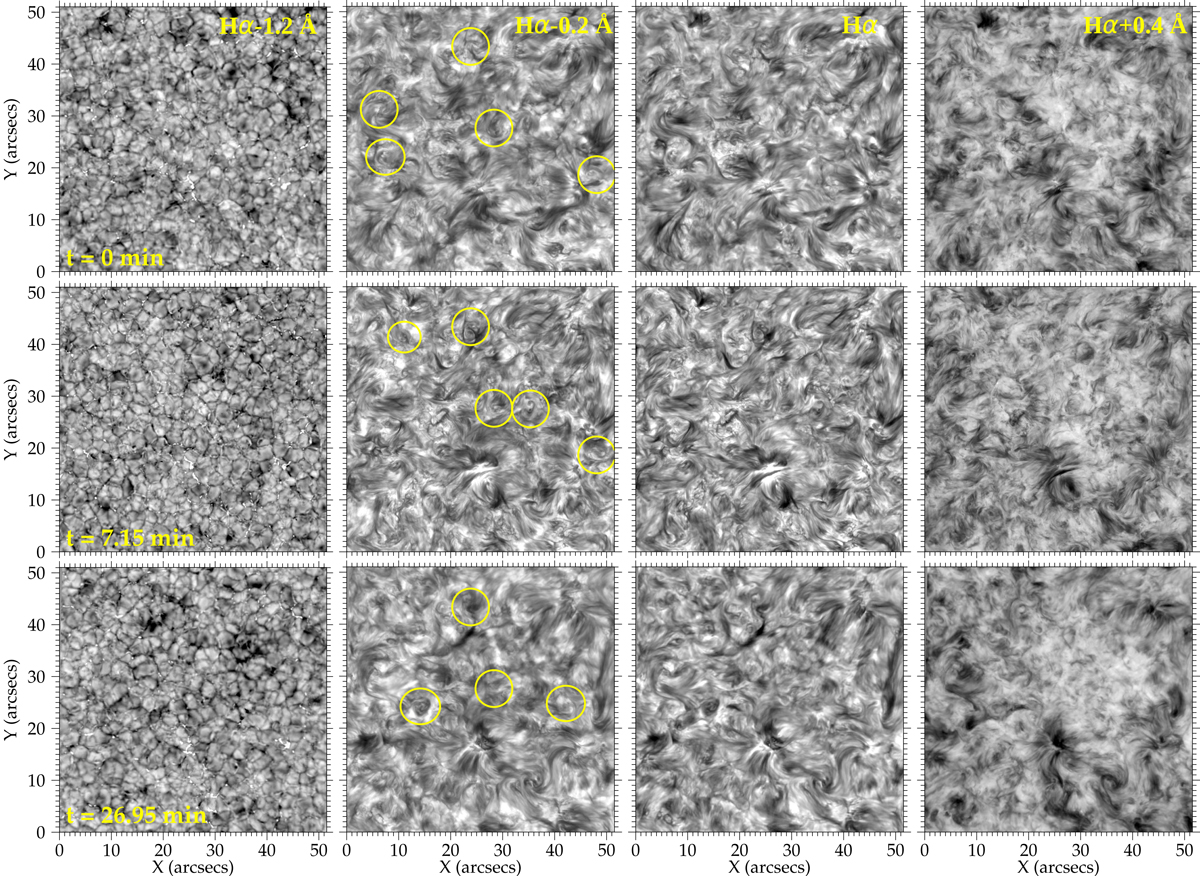
Fig. 1.
Download original image
Overview of the SST/CRISP Hα observations analyzed in this study. Time t = 0 corresponds to 10:20 UT (start of the observations). Each row shows snapshots of intensity maps taken at Hα-1.2 Å, Hα-0.2 Å, Hα line center and Hα+0.6 Å, respectively, while each column corresponds to same-wavelength snapshots at different times of the time sequence. The yellow circles in the second column denote several conspicuous cases of swirls, with the most persistent ones visible in more than one snapshot. An animation of the entire Hα-0.2 Å time sequence clearly displaying the large number of swirls is available online.
Current usage metrics show cumulative count of Article Views (full-text article views including HTML views, PDF and ePub downloads, according to the available data) and Abstracts Views on Vision4Press platform.
Data correspond to usage on the plateform after 2015. The current usage metrics is available 48-96 hours after online publication and is updated daily on week days.
Initial download of the metrics may take a while.