Fig. 1.
Download original image
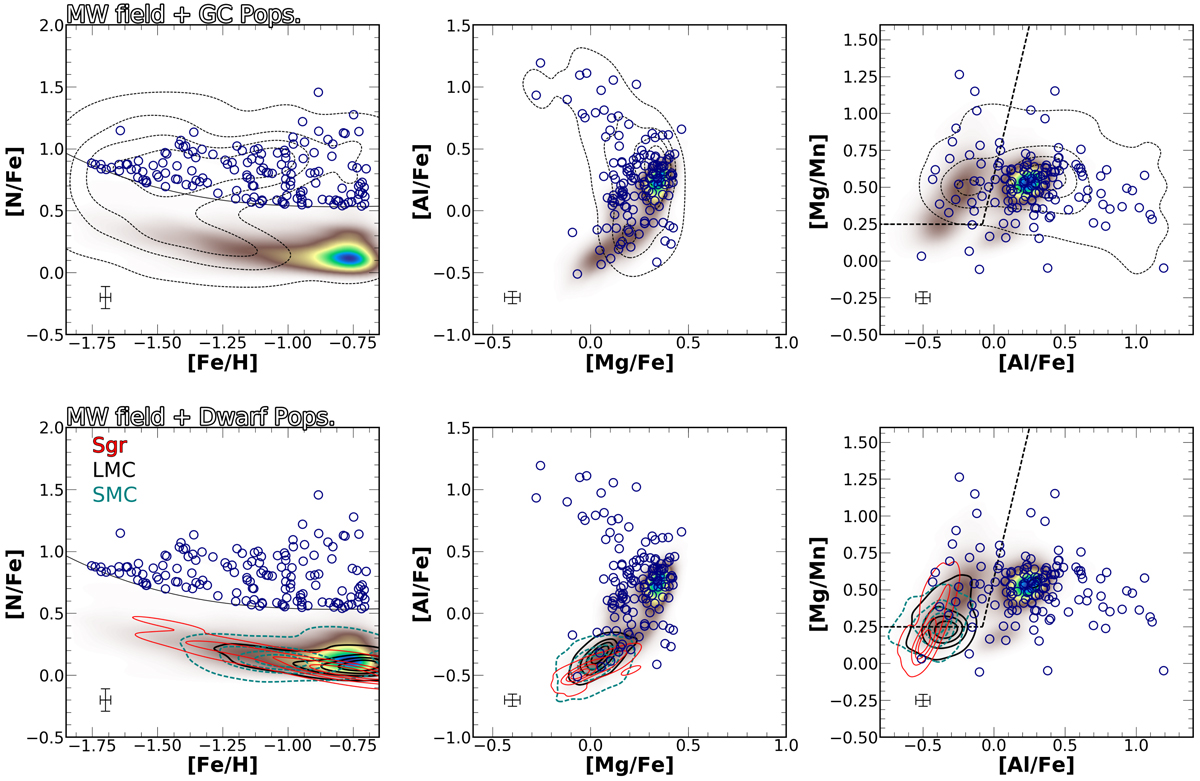
Distribution of [N/Fe] vs. [Fe/H], [Al/Fe] vs. [Mg/Fe], and [Mg/Mn] vs. [Al/Fe] for the newly identified N-rich stars (navy) compared to GC stars (black dashed contours) from Mészáros et al. (2020), LMC (solid black contours), SMC (cyan dashed contours), and Sgr (solid red contours) stars from Helmi et al. (2018) with ASPCAP abundance information. The black dashed lines roughly define the criterion to “distinguish” in situ from accreted populations, similar to that as defined in Das et al. (2020) and Horta et al. (2021). Also included are kernel density estimation (KDE) models showing the density of objects belonging to the MW. The continuous black line in the first column represents the fourth order polynomial fit at the 4σ level selection criterion for N-rich stars as described in the text. Typical error bars are shown as black plus symbols in each panel.
Current usage metrics show cumulative count of Article Views (full-text article views including HTML views, PDF and ePub downloads, according to the available data) and Abstracts Views on Vision4Press platform.
Data correspond to usage on the plateform after 2015. The current usage metrics is available 48-96 hours after online publication and is updated daily on week days.
Initial download of the metrics may take a while.