Free Access
Fig. 5
Download original image
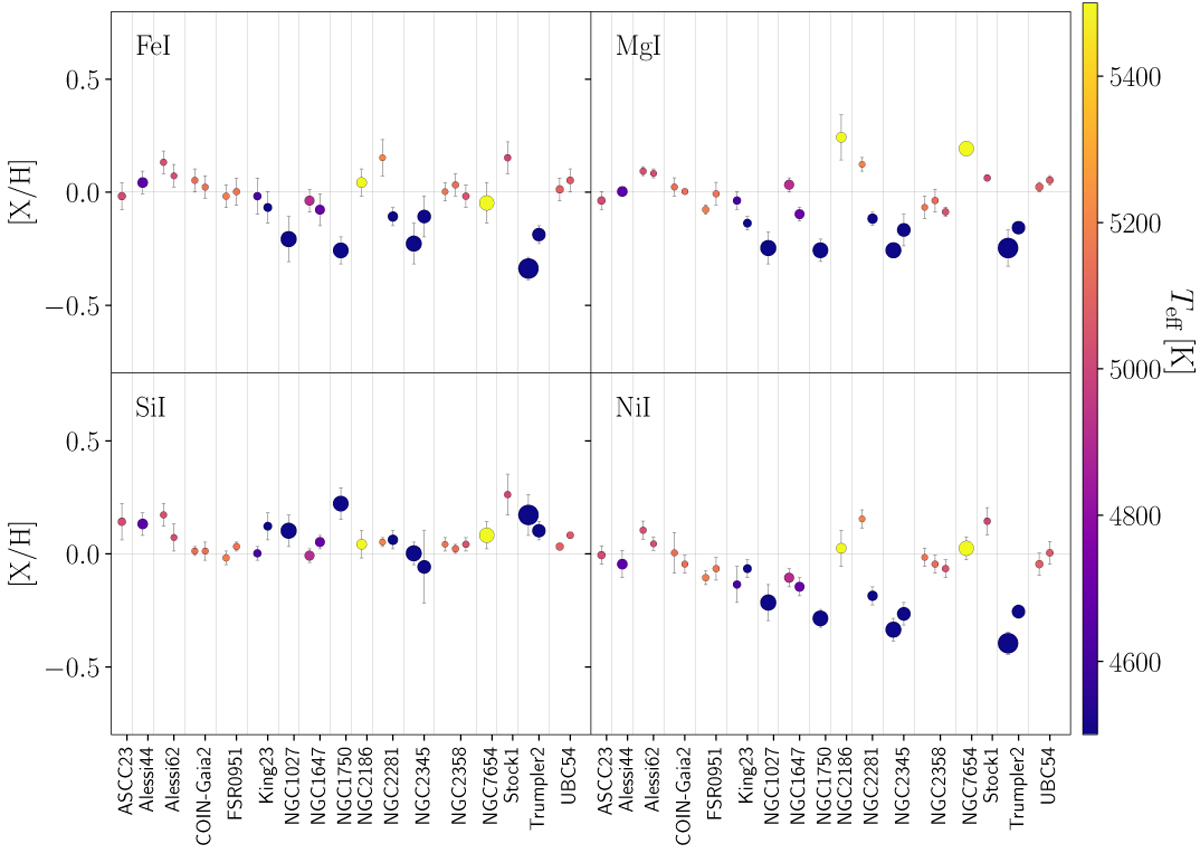
Individual star abundances from Fe i, Mg i, Si i, and Ni i lines. Stars are coloured according to the effective temperature, and their size is proportional to the surface gravity (larger points represent lower surface gravities). vertical lines separate stars from the different clusters.
Current usage metrics show cumulative count of Article Views (full-text article views including HTML views, PDF and ePub downloads, according to the available data) and Abstracts Views on Vision4Press platform.
Data correspond to usage on the plateform after 2015. The current usage metrics is available 48-96 hours after online publication and is updated daily on week days.
Initial download of the metrics may take a while.