Free Access
Fig. 11
Download original image
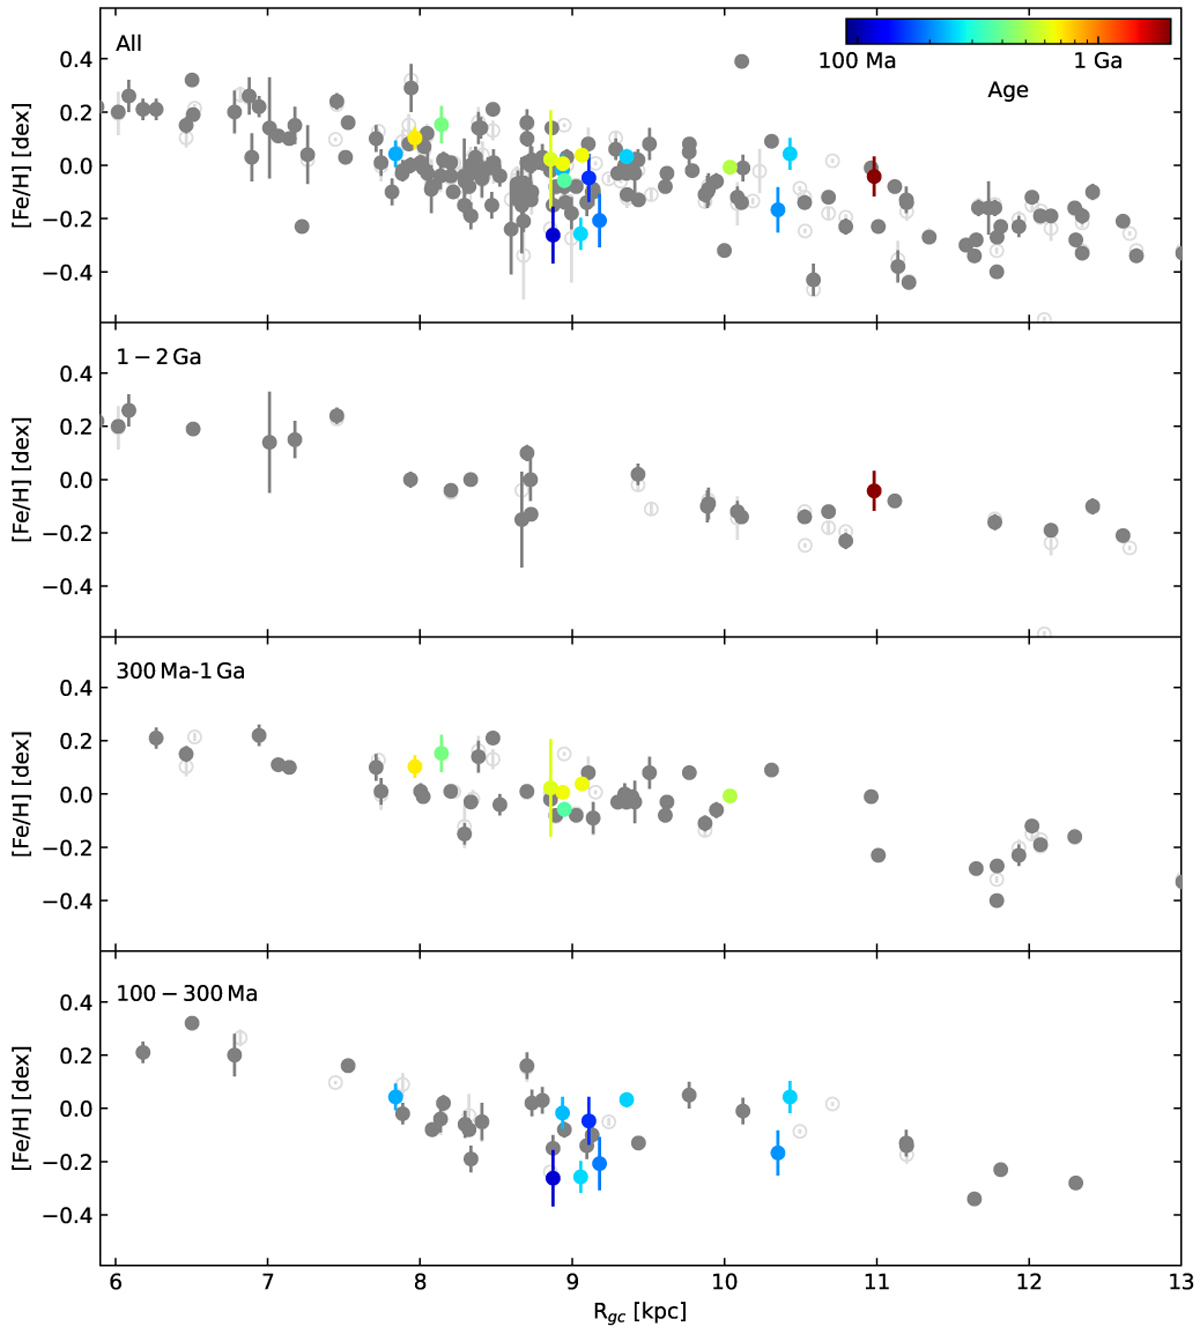
Run of [Fe/H] versus Rgc for the studied clusters, colour-coded as a function of their age. Dark and light grey points are the clusters in Zhang et al. (2021) and Spina et al. (2021), respectively, which are plotted for comparison. Top panel: whole sample, while the remaining panels show three different age ranges.
Current usage metrics show cumulative count of Article Views (full-text article views including HTML views, PDF and ePub downloads, according to the available data) and Abstracts Views on Vision4Press platform.
Data correspond to usage on the plateform after 2015. The current usage metrics is available 48-96 hours after online publication and is updated daily on week days.
Initial download of the metrics may take a while.