Open Access
Fig. 4.
Download original image
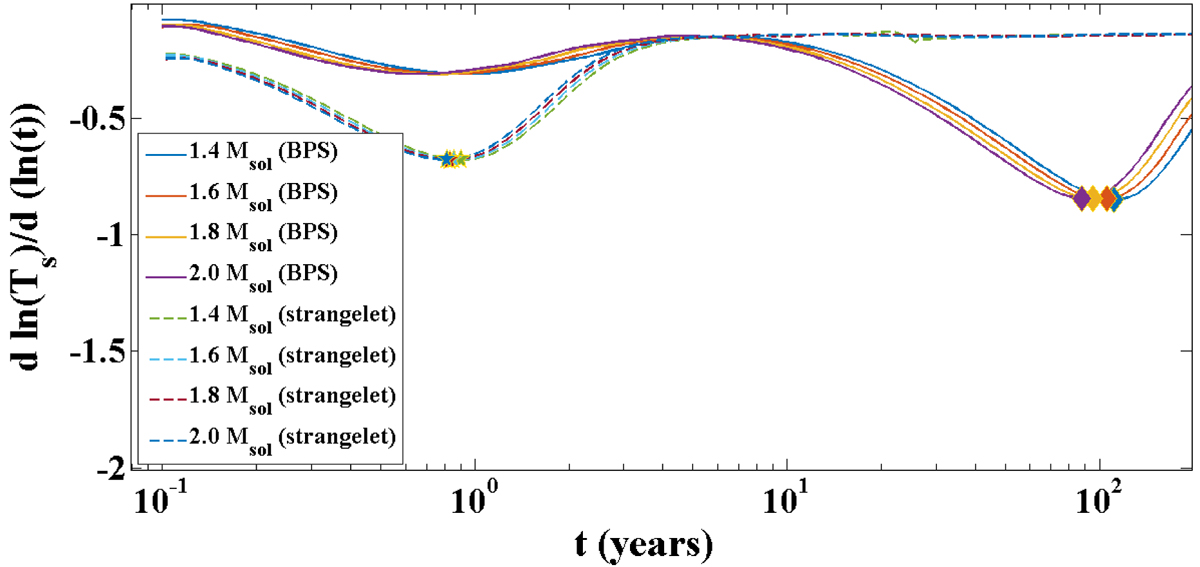
lnTs variation rate with respect to lnt versus age for our QSs from Fig. 3. Solid lines are QS (BPS) crusts, and dashed lines are strangelet crusts. The highlighted diamond and star points represent the moment of the most negative slope, i.e., their relaxation times.
Current usage metrics show cumulative count of Article Views (full-text article views including HTML views, PDF and ePub downloads, according to the available data) and Abstracts Views on Vision4Press platform.
Data correspond to usage on the plateform after 2015. The current usage metrics is available 48-96 hours after online publication and is updated daily on week days.
Initial download of the metrics may take a while.