Open Access
Fig. 3.
Download original image
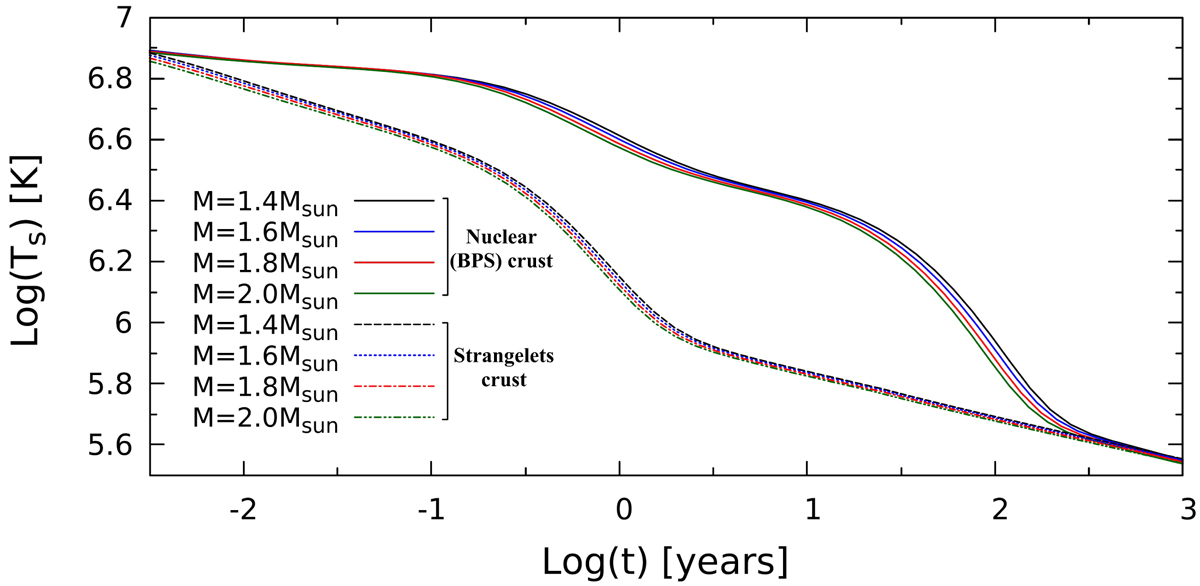
Cooling of QSs with gravitational masses from Table 1. Ts denotes the redshifted temperature, and the x axis is the age, t, in years. Solid lines (upper band) represent QSs with a nuclear (BPS) crust, and dashed lines (lower band) are stars with a strangelet crust.
Current usage metrics show cumulative count of Article Views (full-text article views including HTML views, PDF and ePub downloads, according to the available data) and Abstracts Views on Vision4Press platform.
Data correspond to usage on the plateform after 2015. The current usage metrics is available 48-96 hours after online publication and is updated daily on week days.
Initial download of the metrics may take a while.