Fig. 7

Download original image
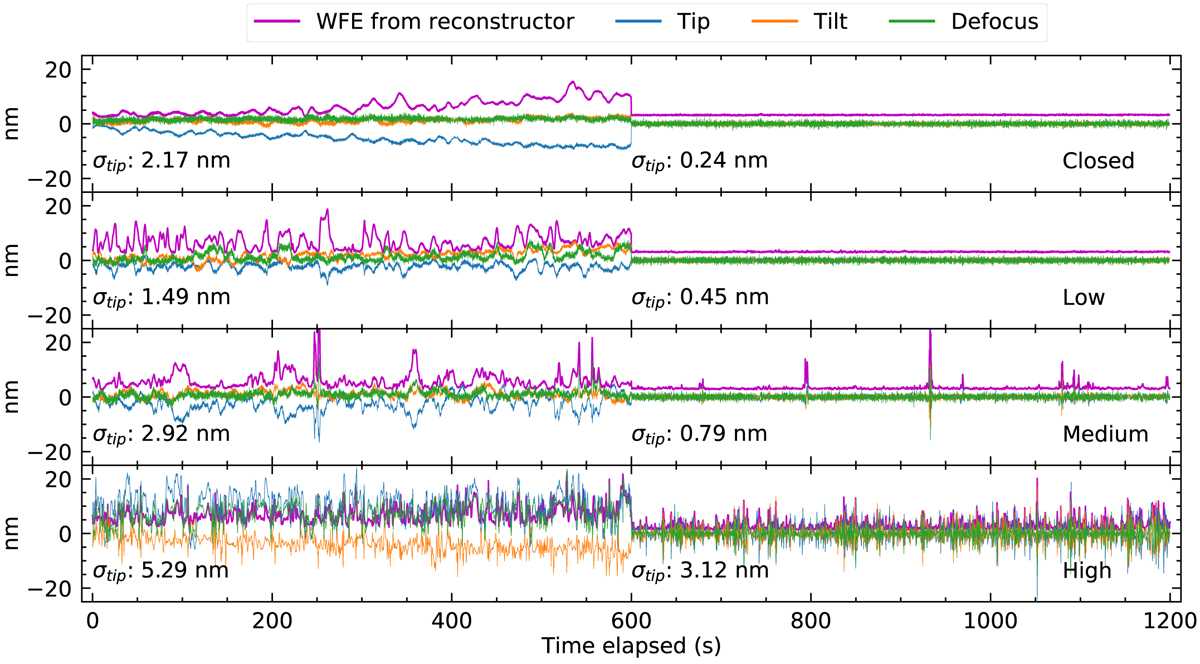
Temporal evolution of the wavefront error with different levels of air turbulence. Global WFE measured by second-order reconstructor is plotted in magenta. Tip, tilt, and defocus coefficients estimated by the inverse Jacobian matrix are plotted in blue, orange, and green, respectively. The plots are ranked from top to bottom from no external air flow to maximum air flow. The experiment consisted of 15 minutes of open loop, followed by 15 minutes of closed loop, under natural drifting conditions. Nominal operations for HiCAT correspond to “closed” and “low”, and the “medium/high” configurations are only used to study the performance of the ZWFS in a suboptimal regime.
Current usage metrics show cumulative count of Article Views (full-text article views including HTML views, PDF and ePub downloads, according to the available data) and Abstracts Views on Vision4Press platform.
Data correspond to usage on the plateform after 2015. The current usage metrics is available 48-96 hours after online publication and is updated daily on week days.
Initial download of the metrics may take a while.


