Fig. 5
Download original image
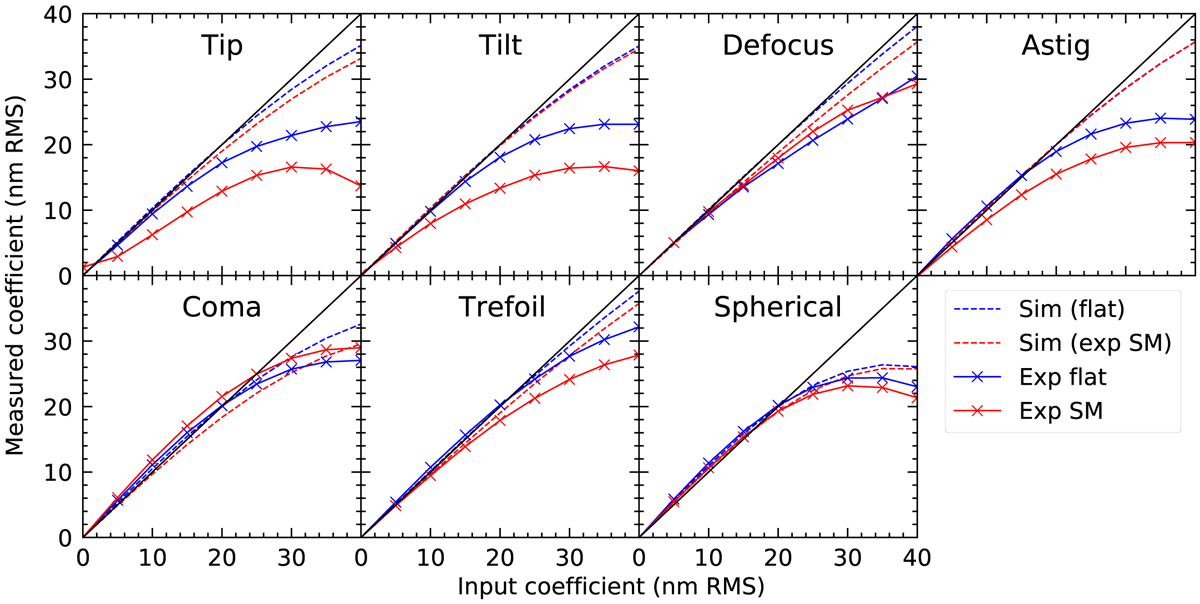
Response curves of the ZWFS to low-order Zernike modes, in simulation (dotted lines) and from HiCAT experiments (solid lines with cross markers). The ZWFS has been calibrated around the DM flat maps that optimize wavefront quality. Response curves are measured both around these flat maps (blue curves) and around SM commands (red curves).
Current usage metrics show cumulative count of Article Views (full-text article views including HTML views, PDF and ePub downloads, according to the available data) and Abstracts Views on Vision4Press platform.
Data correspond to usage on the plateform after 2015. The current usage metrics is available 48-96 hours after online publication and is updated daily on week days.
Initial download of the metrics may take a while.