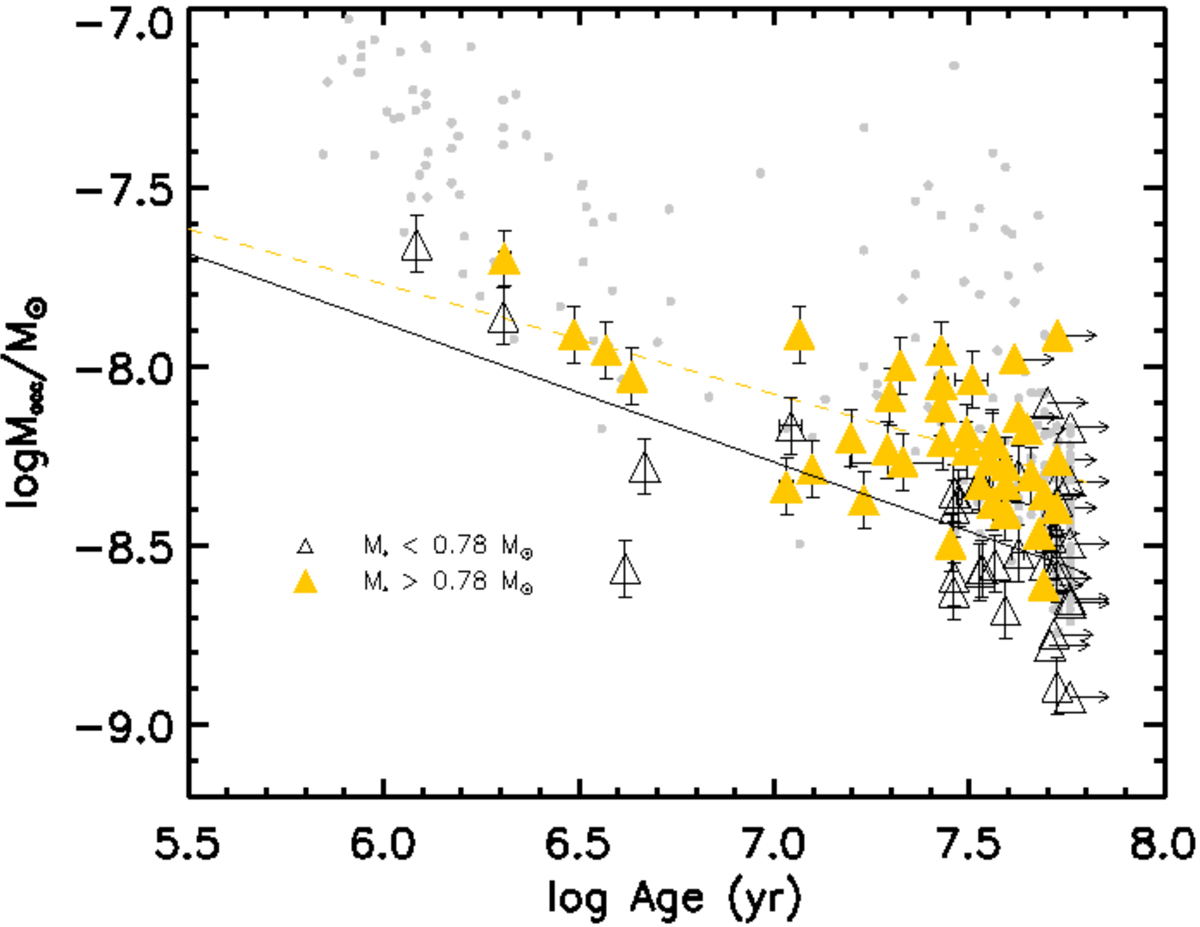
Fig. 9.
Download original image
Observed mass accretion rate versus age in LH 91. Yellow filled squares and empty black triangles represent the targets with mass greater and smaller than the median mass of the PMS candidates sample, respectively. The gray-filled dots are the PMS candidates in LH 95 (Biazzo et al. 2019). The error bars on the age and mass accretion rate are reported. When the uncertainties are smaller than the symbol size, they are not visible. The arrows represent lower limits. The dashed yellow and solid black lines represent the regression fit of the two subsamples of LH 91.
Current usage metrics show cumulative count of Article Views (full-text article views including HTML views, PDF and ePub downloads, according to the available data) and Abstracts Views on Vision4Press platform.
Data correspond to usage on the plateform after 2015. The current usage metrics is available 48-96 hours after online publication and is updated daily on week days.
Initial download of the metrics may take a while.