Fig. 7
Download original image
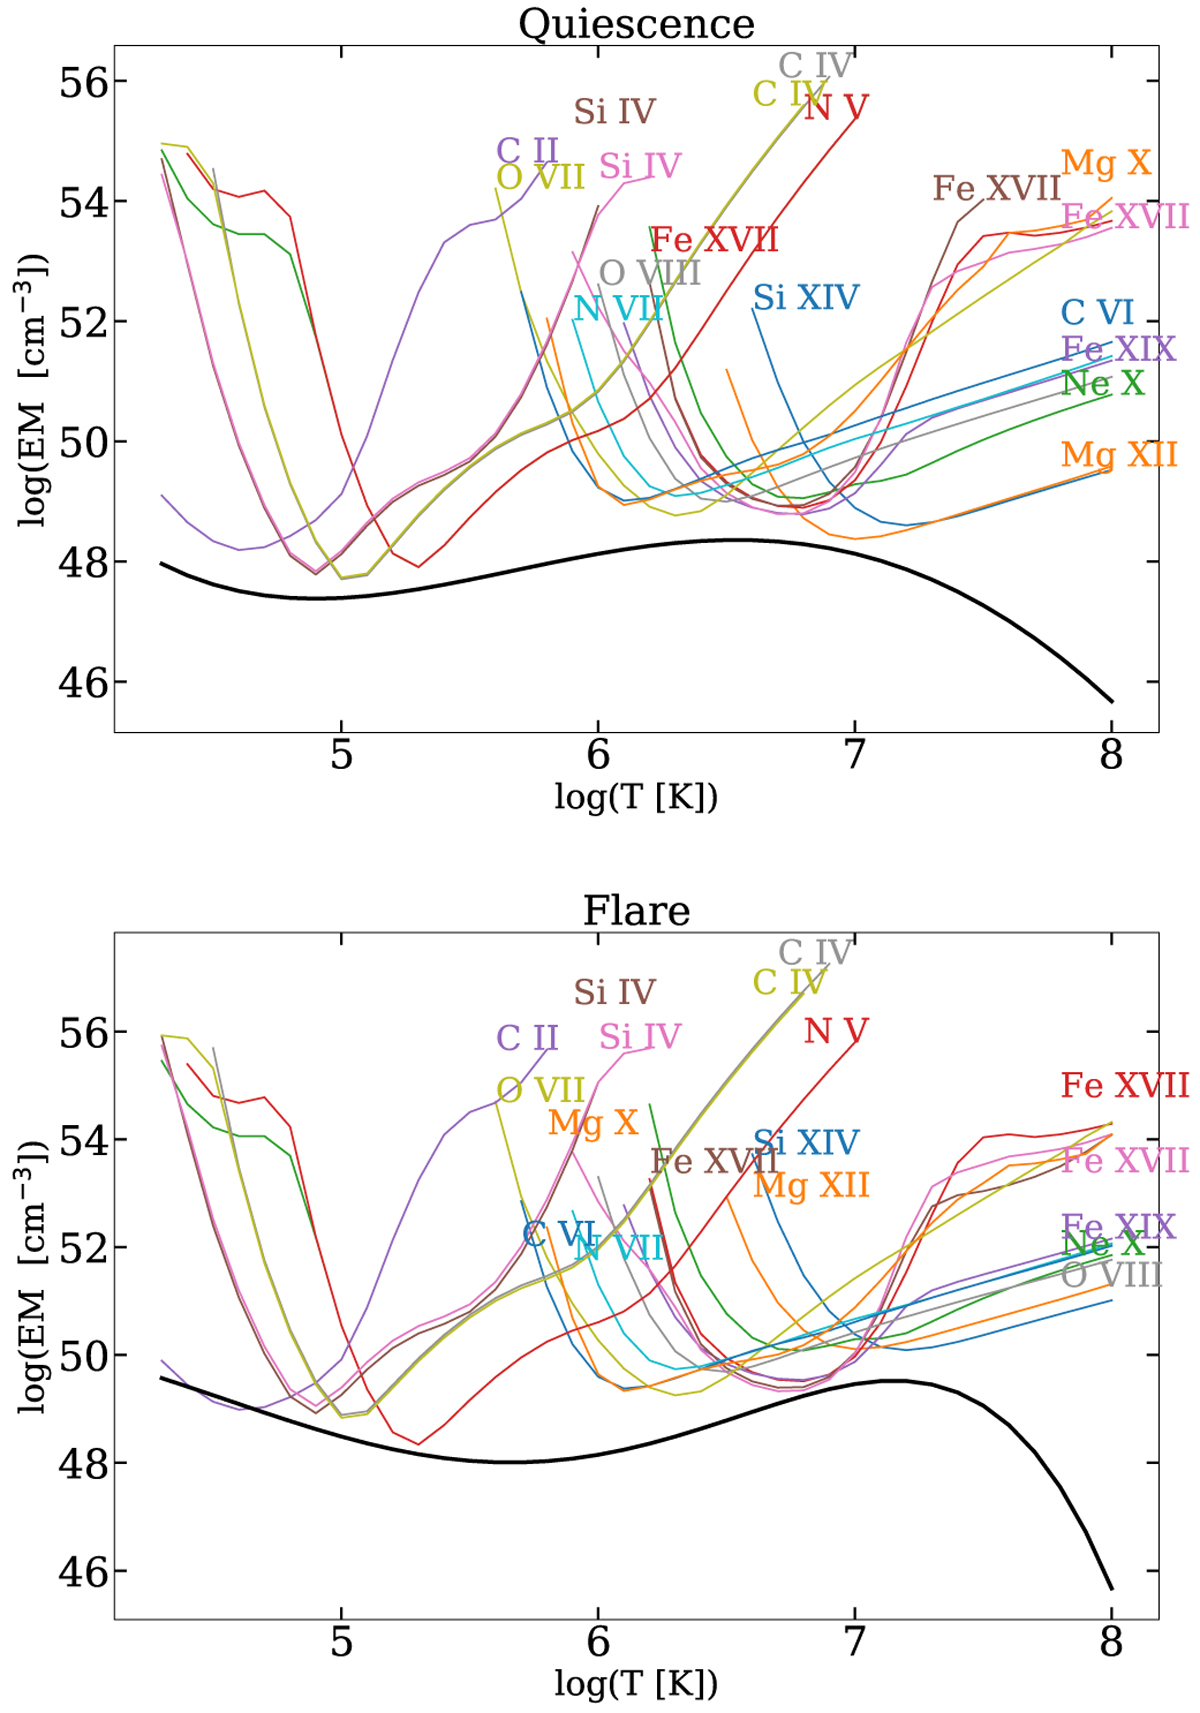
Discretised emission measure distribution of Proxima Centauri (black line) during quiescence (top) and during combined flare periods (bottom). As assumed by the fitting model, the emission measure vanishes at high temperatures. Coloured lines represent the observed line fluxes divided by their contribution function. Their minima are at the peak formation temperatures of the respective line.
Current usage metrics show cumulative count of Article Views (full-text article views including HTML views, PDF and ePub downloads, according to the available data) and Abstracts Views on Vision4Press platform.
Data correspond to usage on the plateform after 2015. The current usage metrics is available 48-96 hours after online publication and is updated daily on week days.
Initial download of the metrics may take a while.