Free Access
Fig. 6
Download original image
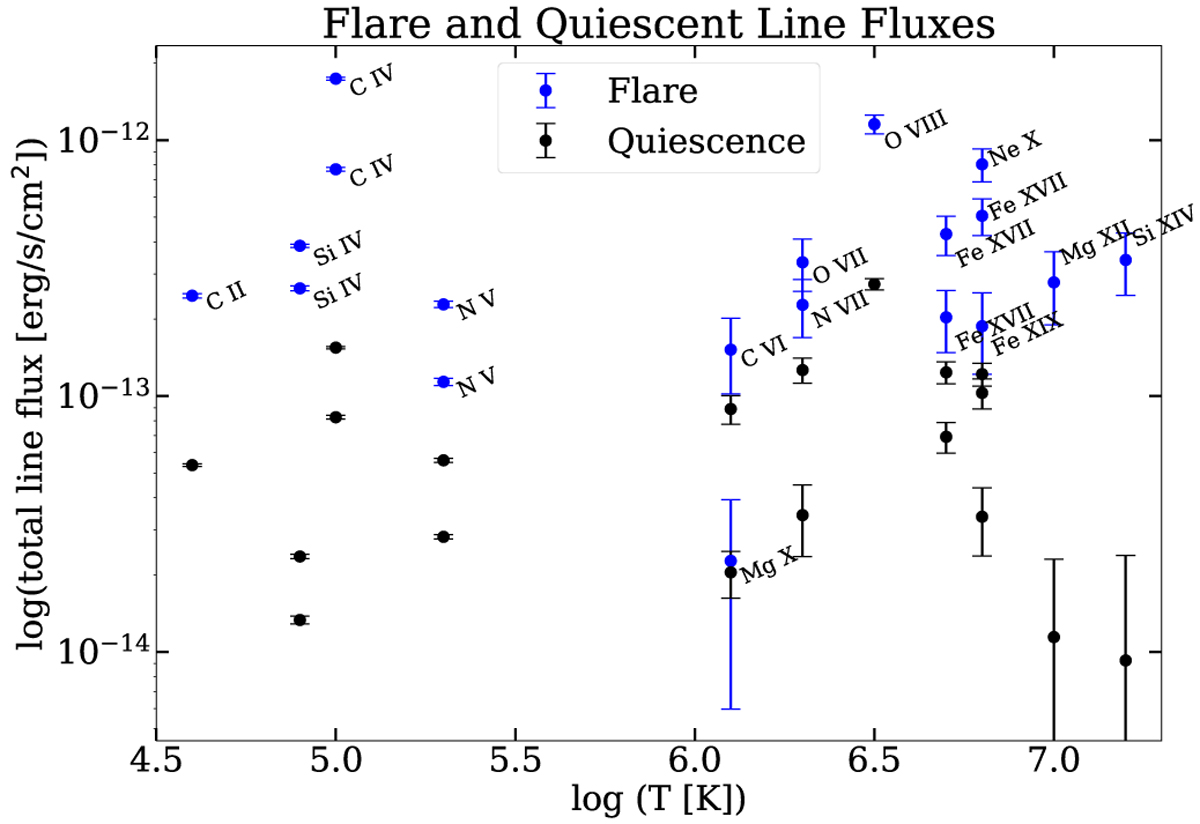
Total line fluxes of all X-ray and FUV emission lines plotted versus their peak formation temperatures during flares (blue) and quiescence (black). Both wavelength regimes are clearly distinct, with the FUV lines being below 105.5 K and the X-ray lines being above 106.0 K.
Current usage metrics show cumulative count of Article Views (full-text article views including HTML views, PDF and ePub downloads, according to the available data) and Abstracts Views on Vision4Press platform.
Data correspond to usage on the plateform after 2015. The current usage metrics is available 48-96 hours after online publication and is updated daily on week days.
Initial download of the metrics may take a while.