Fig. 11
Download original image
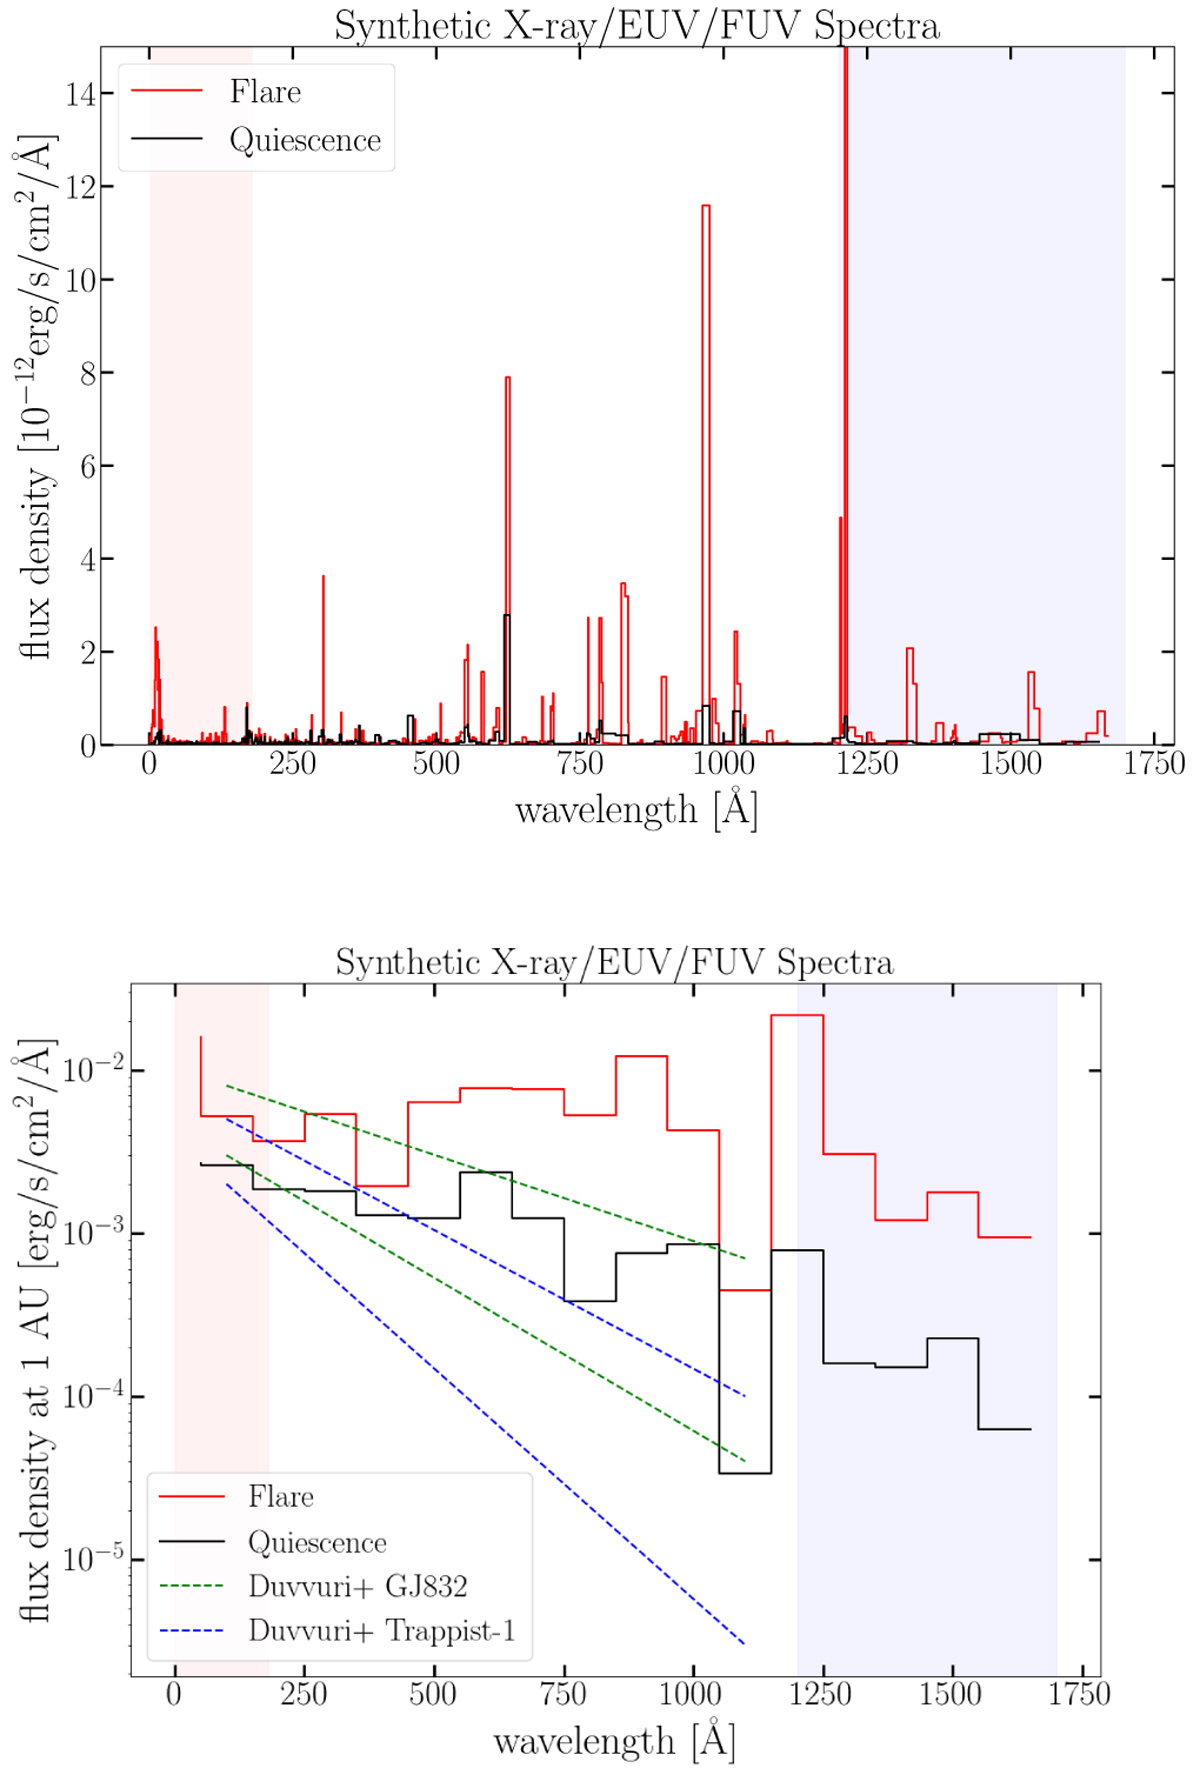
Synthetic spectra in the range of 1–1700 Å, calculated from the DEMs for quiescent (black) and flaring (red) state of Proxima Centauri. The pink shaded region marks the wavelength coverage of our Chandra data, while the blue shaded region marks the coverage of the Hubble data. For the flaring state, the highest amplitude by far is seen for the Lyα line, which cannot be predicted well by our data since the line is formed at lower temperatures. The flux density was binned by a minimum flux of 2 × 10⁻¹⁴ erg s−1 cm−2 Å−1 per bin (top) and by 100 Å bins (bottom) at a distance of 1 AU.
Current usage metrics show cumulative count of Article Views (full-text article views including HTML views, PDF and ePub downloads, according to the available data) and Abstracts Views on Vision4Press platform.
Data correspond to usage on the plateform after 2015. The current usage metrics is available 48-96 hours after online publication and is updated daily on week days.
Initial download of the metrics may take a while.