Fig. 1
Download original image
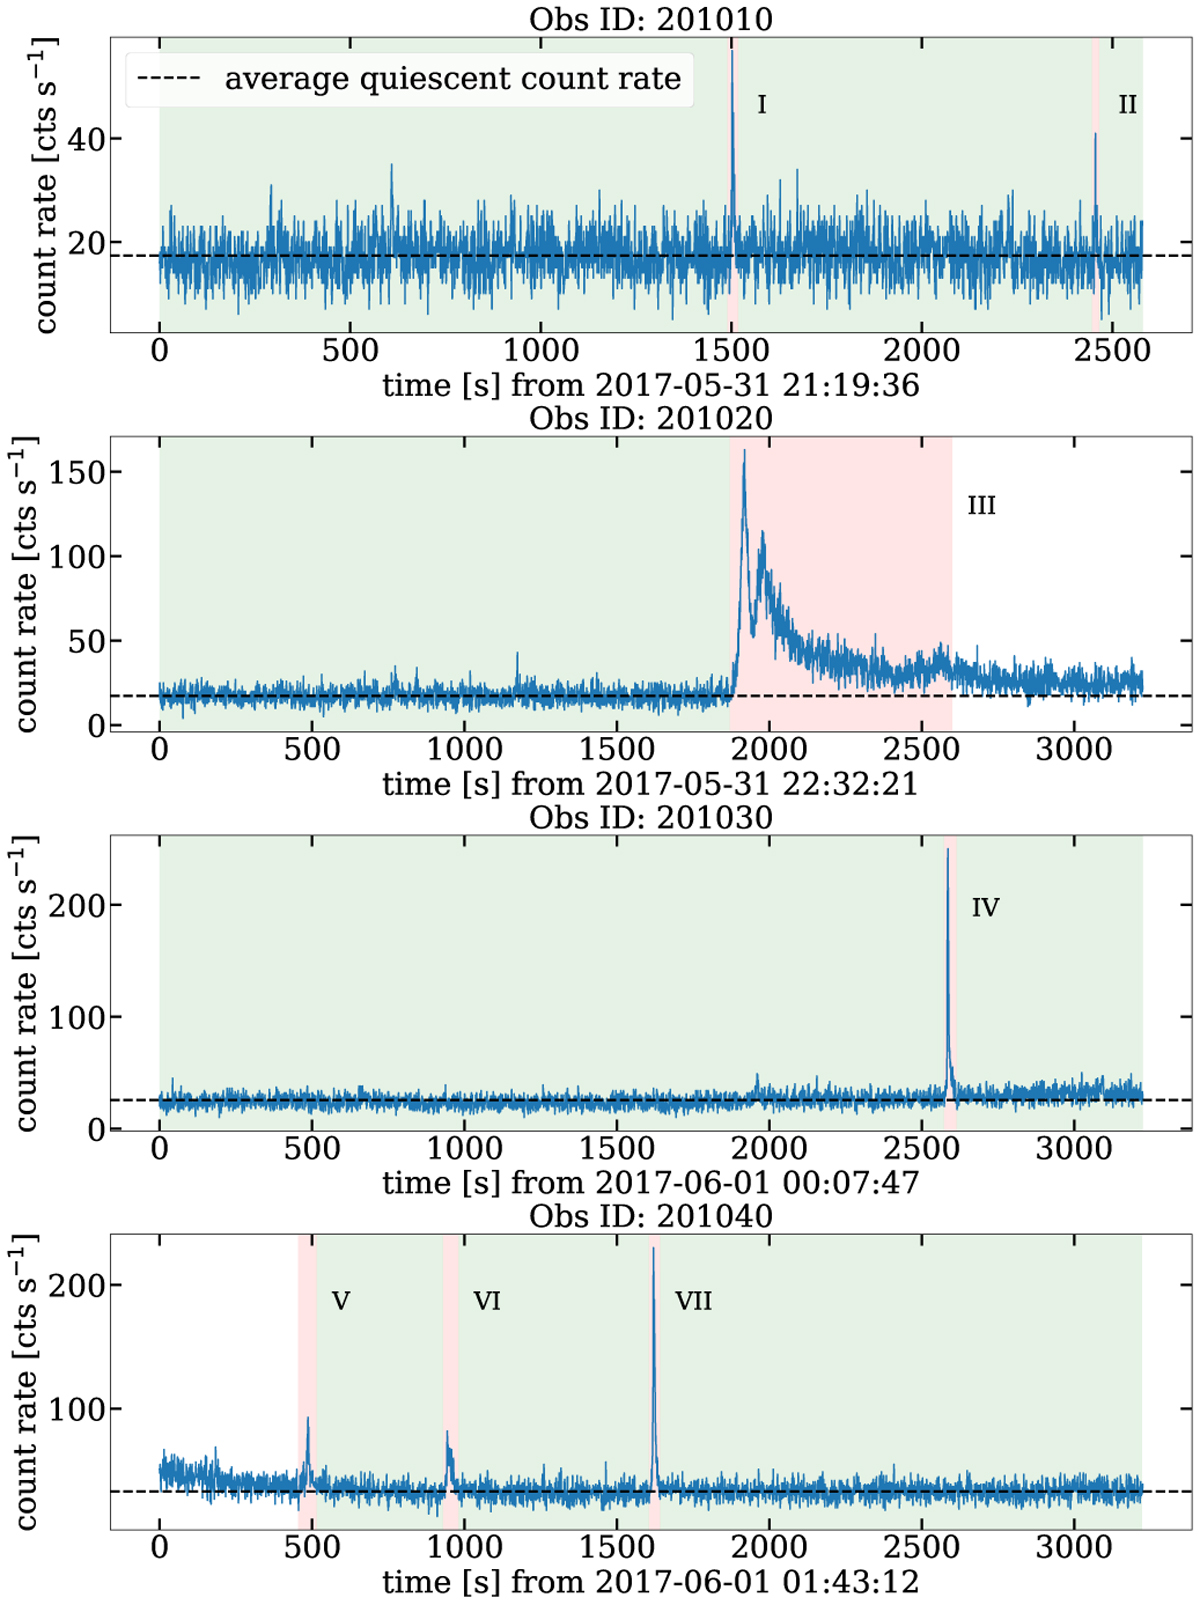
Background-subtracted FUV light curves of Hubble/STIS observations (blue line). The red shaded areas indicate flares, which are labelled with roman numerals. The green shaded areas show quiescent time intervals. The non-shaded intervals are classified as being in an intermediate state. The dashed horizontal line indicates the average quiescent count rate in the individual observation runs.
Current usage metrics show cumulative count of Article Views (full-text article views including HTML views, PDF and ePub downloads, according to the available data) and Abstracts Views on Vision4Press platform.
Data correspond to usage on the plateform after 2015. The current usage metrics is available 48-96 hours after online publication and is updated daily on week days.
Initial download of the metrics may take a while.