Fig. 9
Download original image
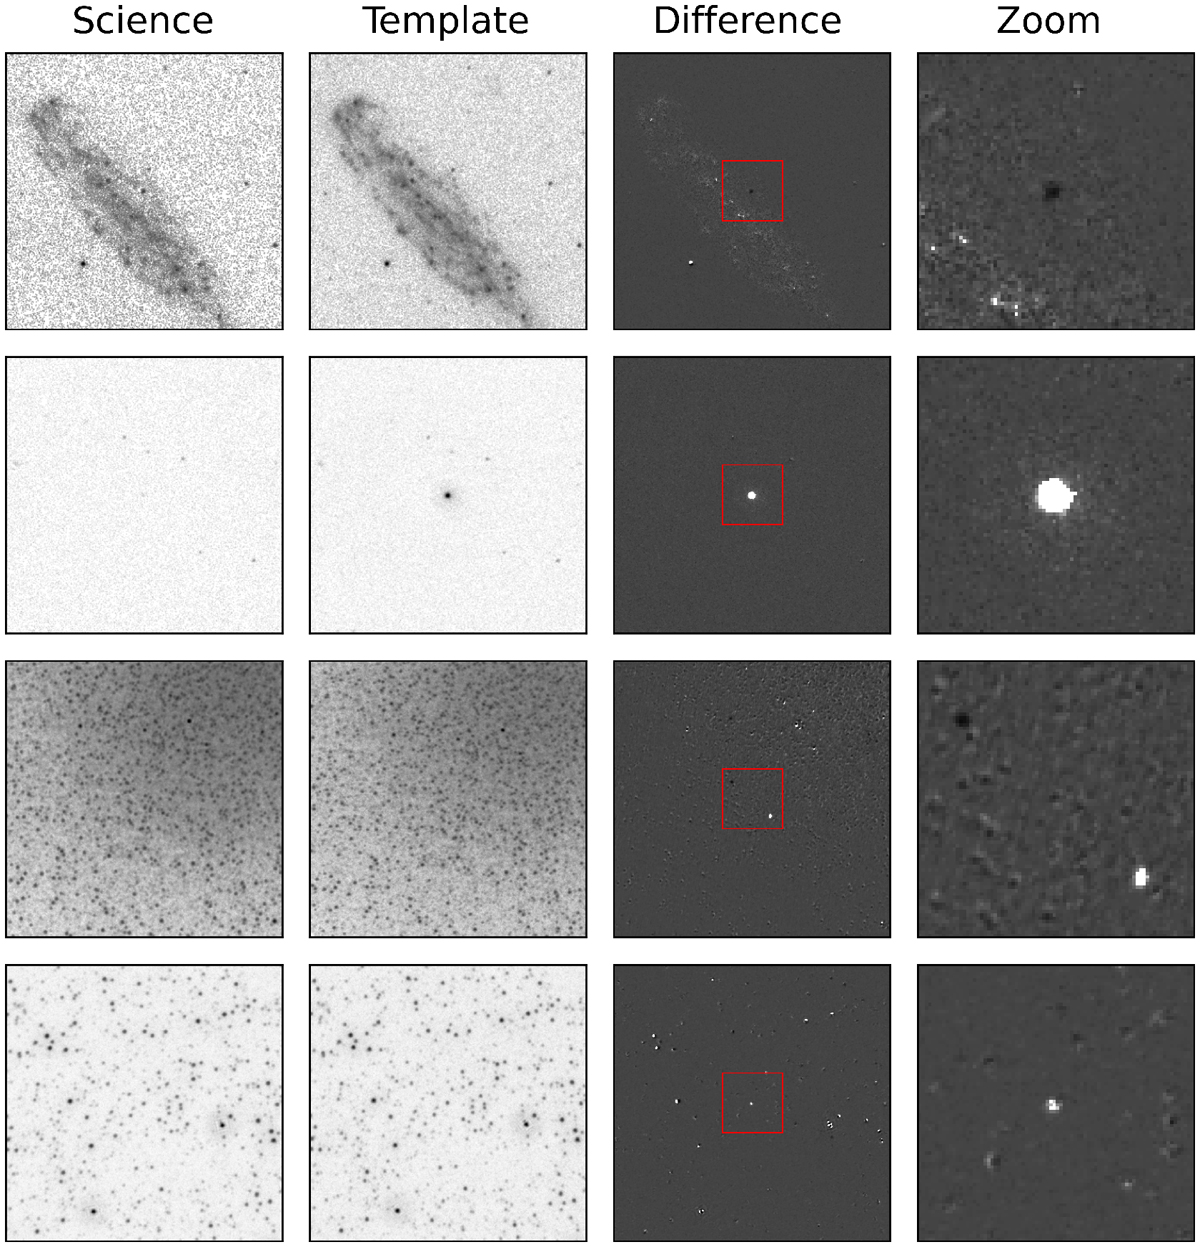
Examples of transient candidates found through the image subtraction process. Each row displays examples for a particular field and filter in which transients were found. From left to right, the columns show the science image, the template image, the difference image, and a zoomed-in view of the difference image to display one or more transients. The red square in the difference images (third column) shows the region displayed in the fourth column. The examples displayed were chosen to show different types of fields observed by UVOT and thus processed by TUVO. From top to bottom, the rows show a field with diffuse emission (where the transient is the supernova SN2021pit), a very empty field (where the transient is the X-ray binary Swift J1357.2-0933), a very crowded field with diffuse emission (where the transient in the top left of the zoom stamp is the star Cl* NGC 5139 NJL 47 and the transient in the bottom right is the star Cl* NGC 5139 NJL 14), and a crowded field (where the transient shown is the RR Lyrae OGLE LMC-SC3 324213). In the displayed stamps, positive flux is shown as black, so ‘negative’ transients, that is, those that were brighter in the template image than in the science image, appear white in the difference images; and ‘positive’ transients, representing sources that are brighter in the science image than in the template image, are black in the difference images. The field names, ObsIDs, and extensions of the science and template images shown (from the top left) are SN2001EL-HOST/00049929023[1]; NGC 1448/00031031001[5]; Swift J1357.2-0933/00031918123[1]; Swift J1357.2-0933/00031918002[1]; OmegaCentauri 1/00037520001[2]; OmegaCentauri 1/00037520004[1]; LMCFIELD 6/00094074015[1]; and LMCFIELD 6/00094074007[1]).
Current usage metrics show cumulative count of Article Views (full-text article views including HTML views, PDF and ePub downloads, according to the available data) and Abstracts Views on Vision4Press platform.
Data correspond to usage on the plateform after 2015. The current usage metrics is available 48-96 hours after online publication and is updated daily on week days.
Initial download of the metrics may take a while.