Fig. 6
Download original image
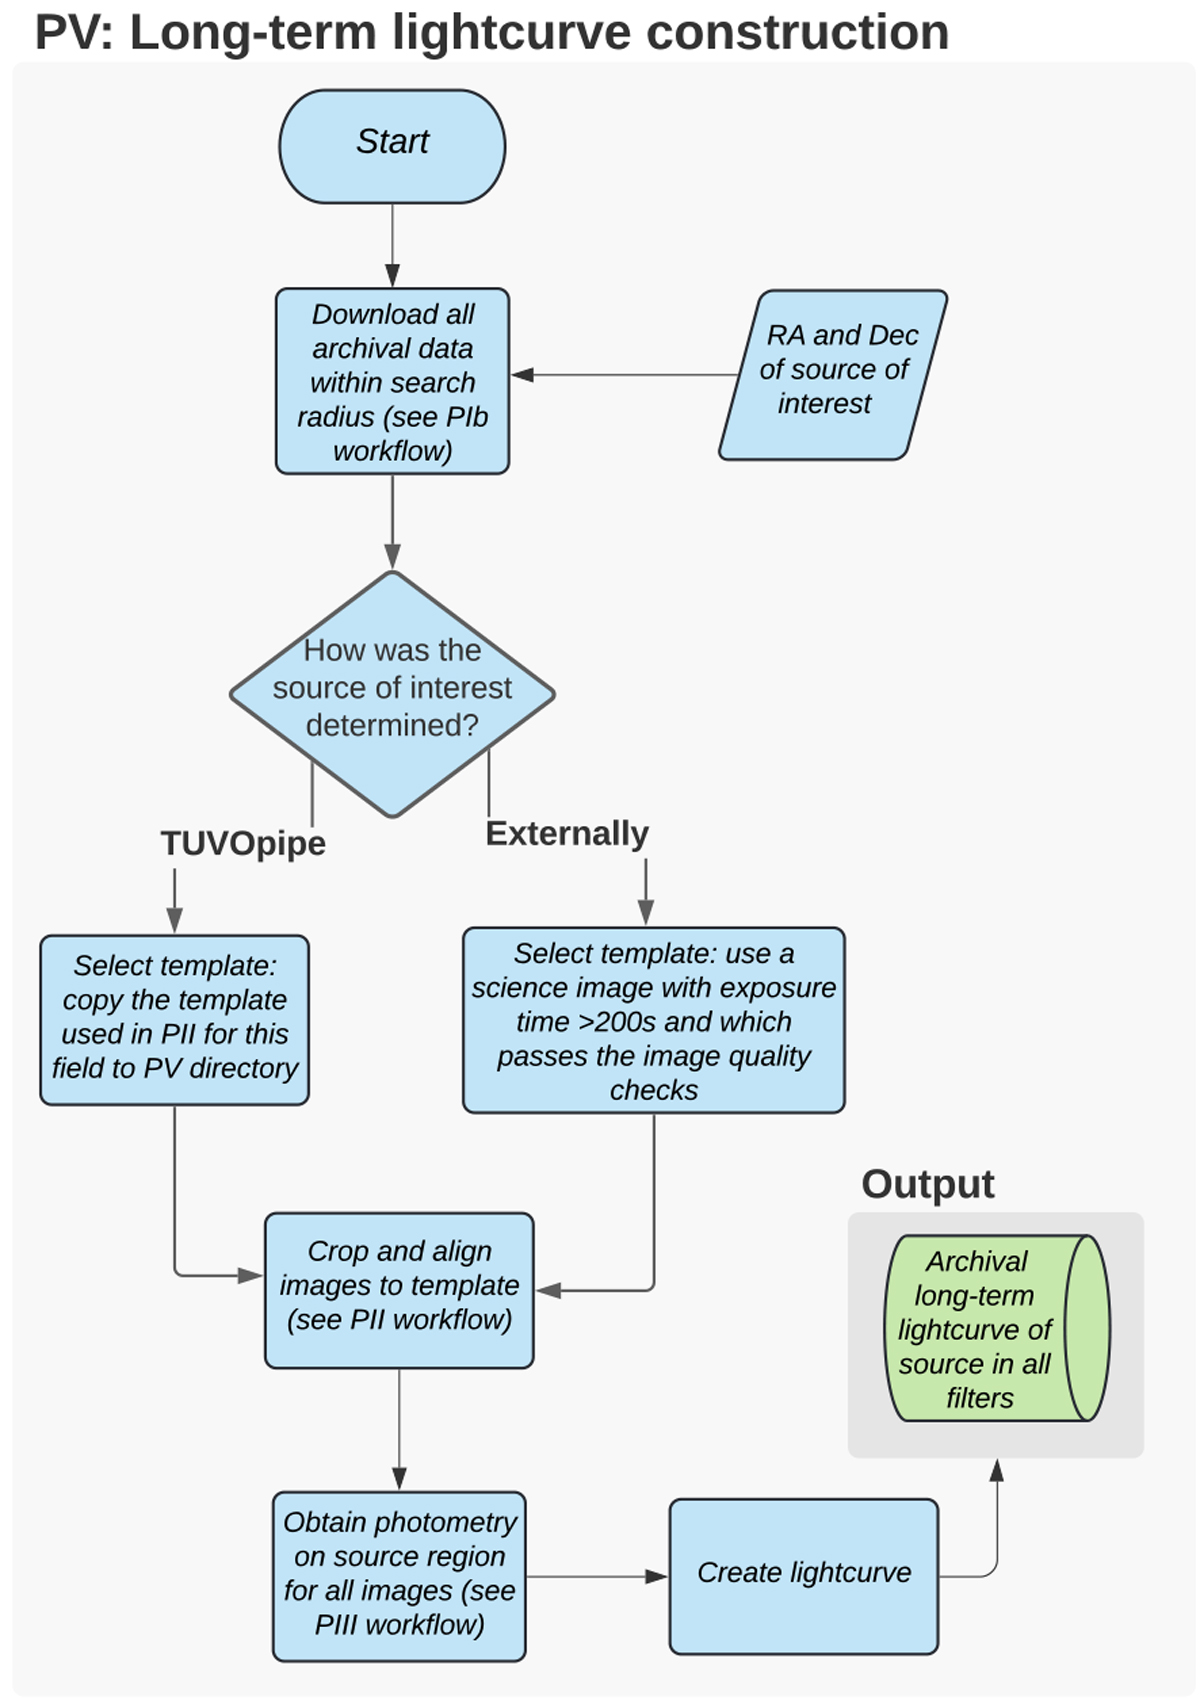
Workflow of PV (discussed in detail in Sect. 3.6). Since most PV functionalities are identical to previous parts of the pipeline, the workflow shown here is highly simplified, and we refer the reader to Figs. 2, 3, 4, and 5 for details. This part of TUVOpipe creates a light curve of any source of interest using all archival UVOT data in all filters. The output of PV (shown in Fig. 15) for a given source is the long-term, multi-band light curve created using all UVOT data.
Current usage metrics show cumulative count of Article Views (full-text article views including HTML views, PDF and ePub downloads, according to the available data) and Abstracts Views on Vision4Press platform.
Data correspond to usage on the plateform after 2015. The current usage metrics is available 48-96 hours after online publication and is updated daily on week days.
Initial download of the metrics may take a while.