Fig. 37
Download original image
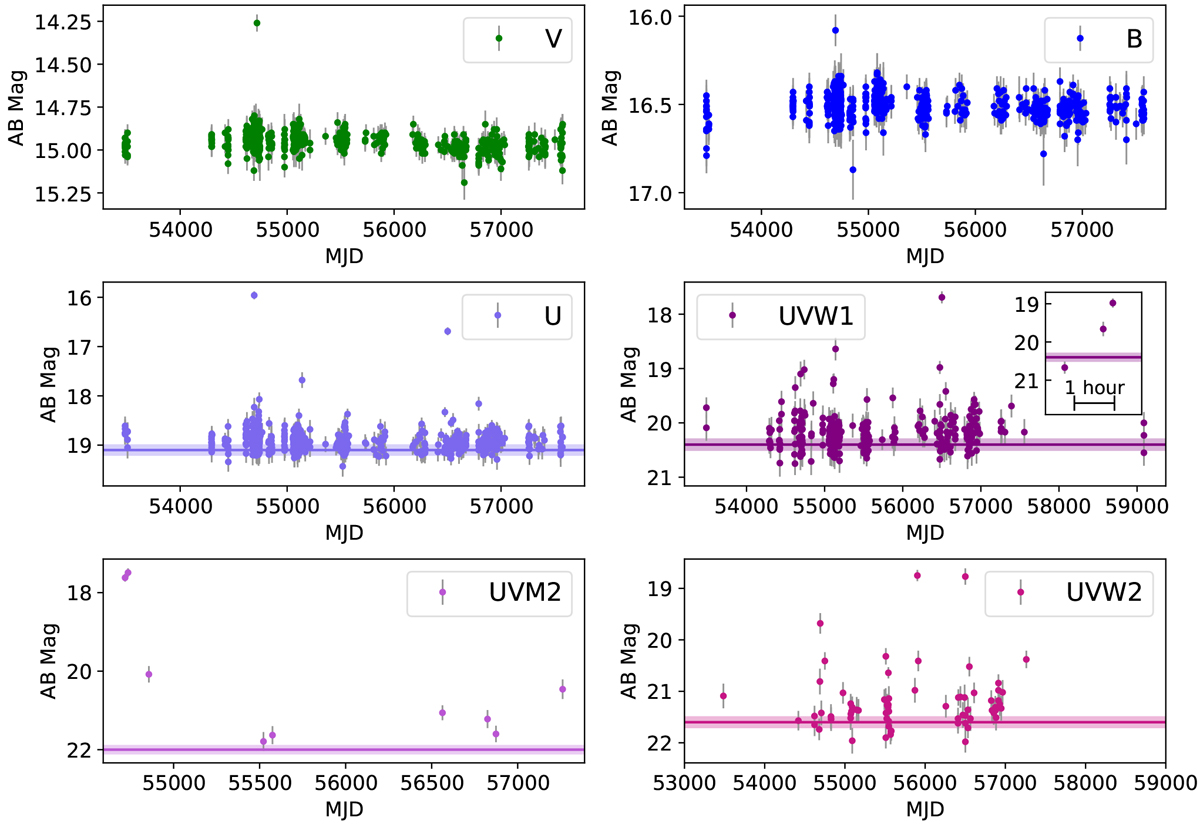
PV light curves, in all available filters created, of the M-dwarf and possible flaring star Sp2254+1606, detected serendipitously with TUVOpipe running in archival mode. For all filters, there were similar numbers of observations, but for figure clarity, upper limits derived from images in which the source was not detected are omitted. Therefore, the lower numbers of displayed data points in the UV light curves compared with the optical light curves simply indicate that the persistent source was not detected in many individual UV images. The horizontal lines represent the brightness (and the shaded regions the corresponding error) of the source detected in the stacked images, which were created by combining all individual images in which there was no detection (this value is therefore not shown for V and Β filters, because the source was always detected in those filters). The inset plot in the UVW1 light curve shows a zoomed-in view of a light curve of the only flare for which there were multiple detections in the same filter, showing the timescale of the event more clearly. See Fig. 36 for the original (PIII) TUVOpipe detection.
Current usage metrics show cumulative count of Article Views (full-text article views including HTML views, PDF and ePub downloads, according to the available data) and Abstracts Views on Vision4Press platform.
Data correspond to usage on the plateform after 2015. The current usage metrics is available 48-96 hours after online publication and is updated daily on week days.
Initial download of the metrics may take a while.