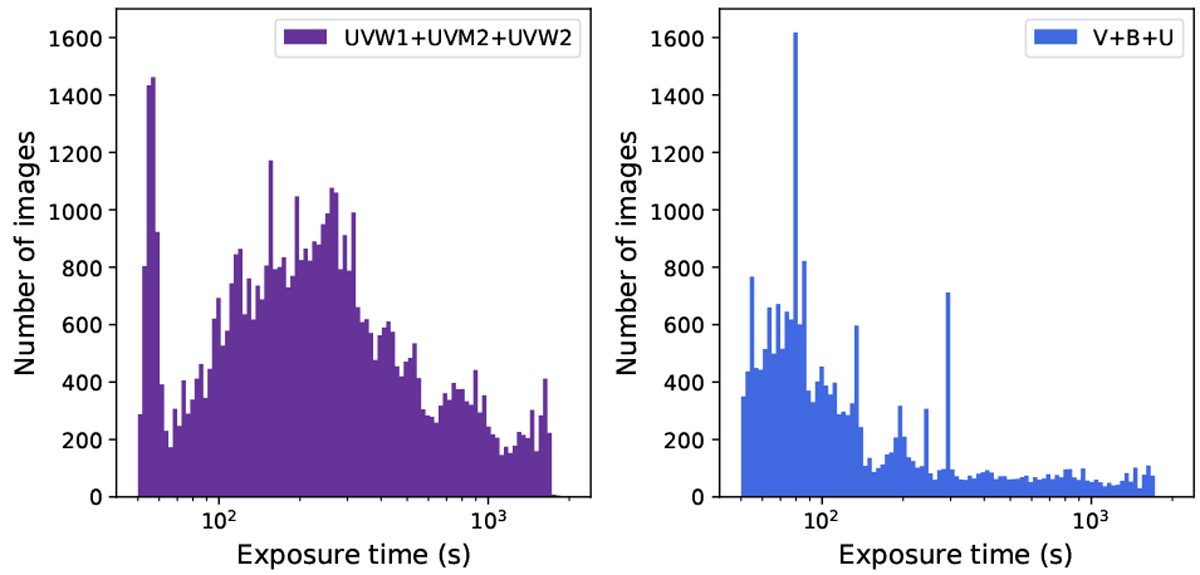
Fig. 20
Download original image
Histograms of UVOT exposure times per wavelength regime (optical and UV) processed by TUVOpipe. This is the same data as shown in Fig. 19, but with the three optical filters combined and the three UV filters combined (the white filter is not included). The x-axes are logarithmic and the bins are evenly spaced in logarithmic space.
Current usage metrics show cumulative count of Article Views (full-text article views including HTML views, PDF and ePub downloads, according to the available data) and Abstracts Views on Vision4Press platform.
Data correspond to usage on the plateform after 2015. The current usage metrics is available 48-96 hours after online publication and is updated daily on week days.
Initial download of the metrics may take a while.