Fig. 17
Download original image
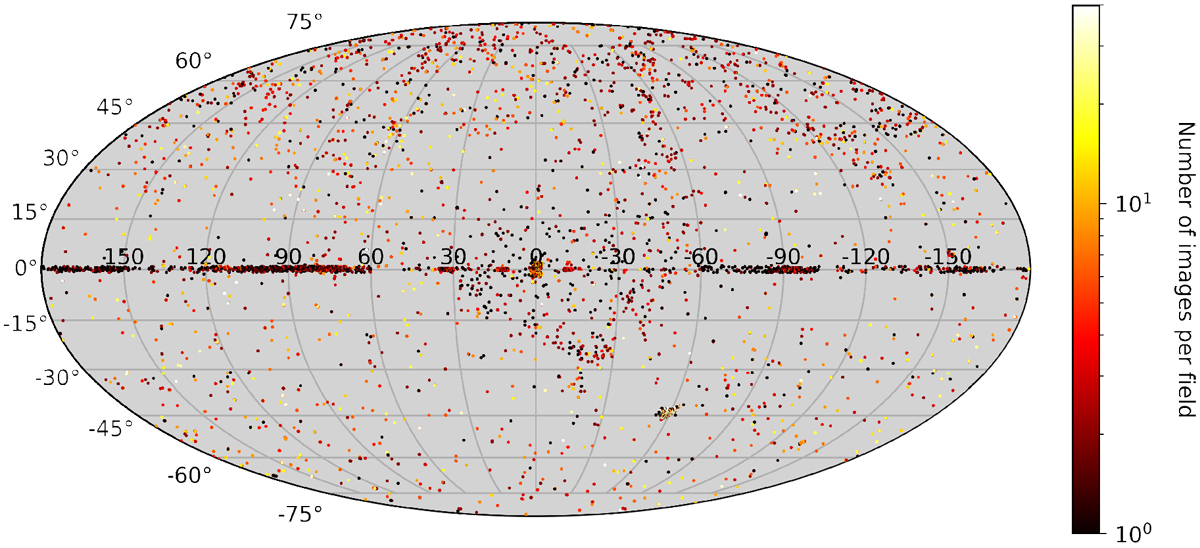
Sky map (Mollweide projection) of all data obtained using the UVOT which were processed by our pipeline (from 01 October 2020 until 23 December 2021). The colour bar indicates the number of images taken for each field (‘fields’ here are based on the coordinates of the centres of the images, rather than on field name). The very high number of observations at −60° and −45° were obtained at the position of the SMC, which Swift has been observing extensively as part of the S-CUBED survey program (Kennea et al. 2018). The total number of images included in the plot is 75 183, representing a total exposure time of 22 686 ks (see also Fig. 18).
Current usage metrics show cumulative count of Article Views (full-text article views including HTML views, PDF and ePub downloads, according to the available data) and Abstracts Views on Vision4Press platform.
Data correspond to usage on the plateform after 2015. The current usage metrics is available 48-96 hours after online publication and is updated daily on week days.
Initial download of the metrics may take a while.