Fig. 16
Download original image
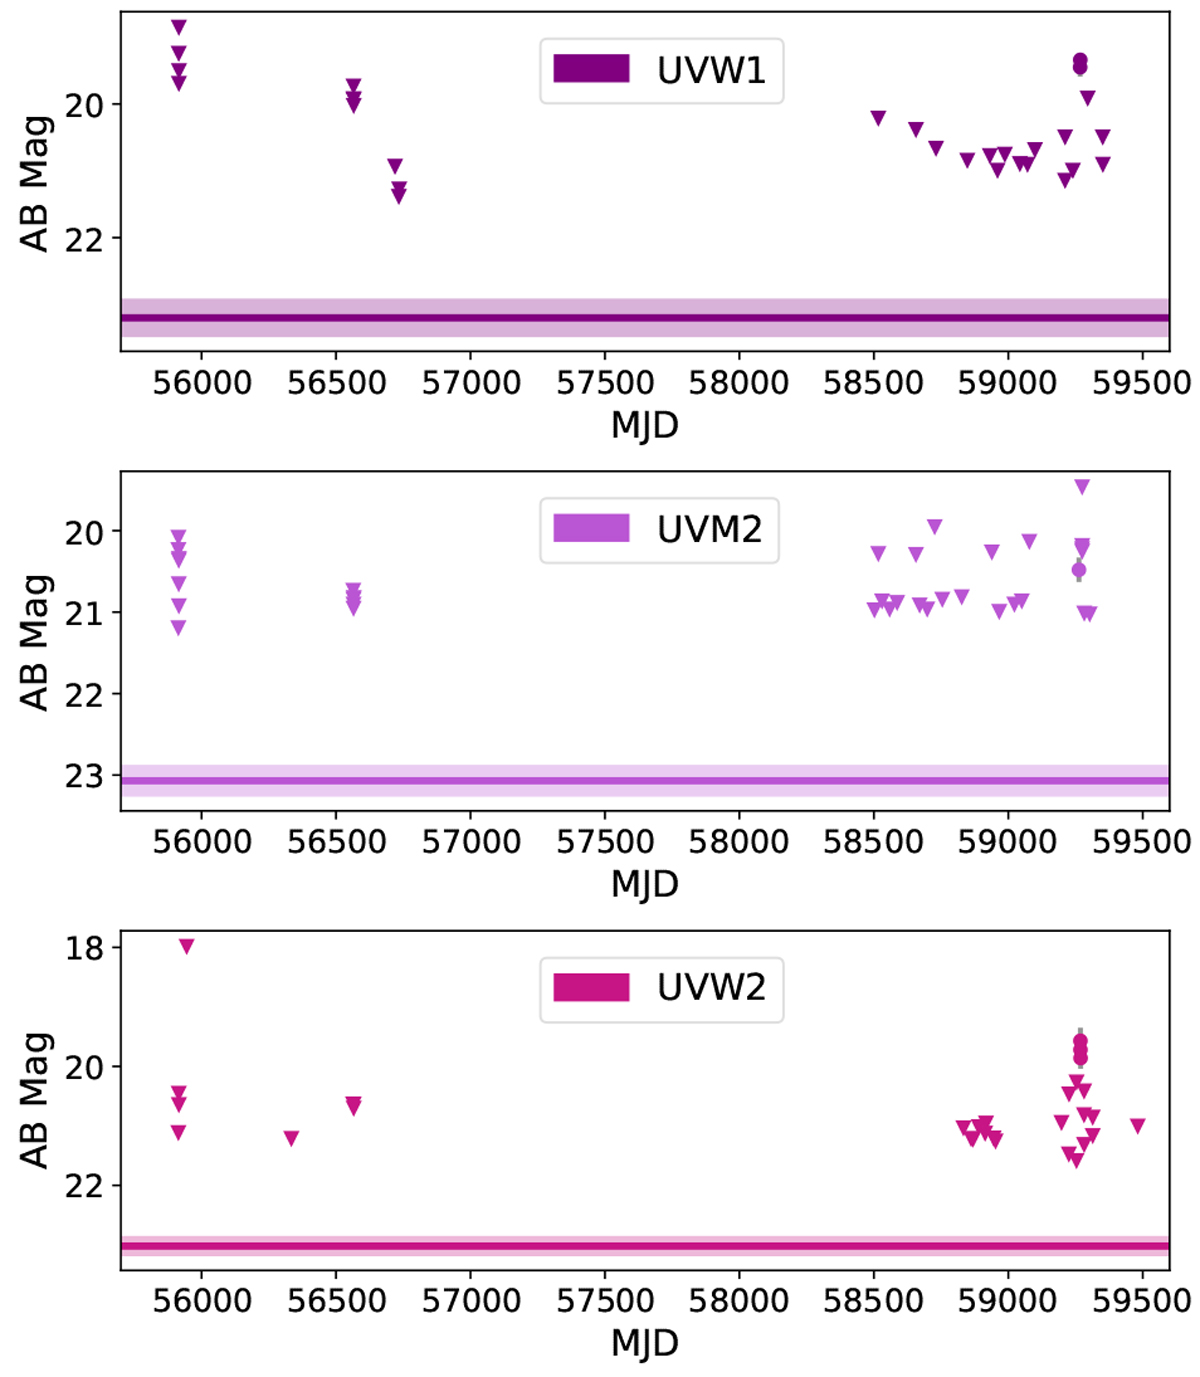
UVW1, UVM2, and UVW2 PV light curves for a source triggered by TUVOpipe, denoted as TUVO-2lacq, due to an outburst detected in February 2021 (see the data points around MJD 59300). The quiescent level of the source is too faint to be detected by individual UVOT images, as seen by the upper limits displayed in the light curves. However, when all the images in which no detection was made are stacked, uvotsource detects a source in the stacked image due to the increased depth. This quiescent level is shown by the horizontal line, with the error shown by the shaded region. This long-term light curve shows that the recent outburst has so far been the only outburst of this source observed using the UVOT. Analysis of the outburst and further spectra obtained (see Sect. 4.2.1) allowed us to securely classify this source as a CV undergoing a DN outburst.
Current usage metrics show cumulative count of Article Views (full-text article views including HTML views, PDF and ePub downloads, according to the available data) and Abstracts Views on Vision4Press platform.
Data correspond to usage on the plateform after 2015. The current usage metrics is available 48-96 hours after online publication and is updated daily on week days.
Initial download of the metrics may take a while.