Fig. 12
Download original image
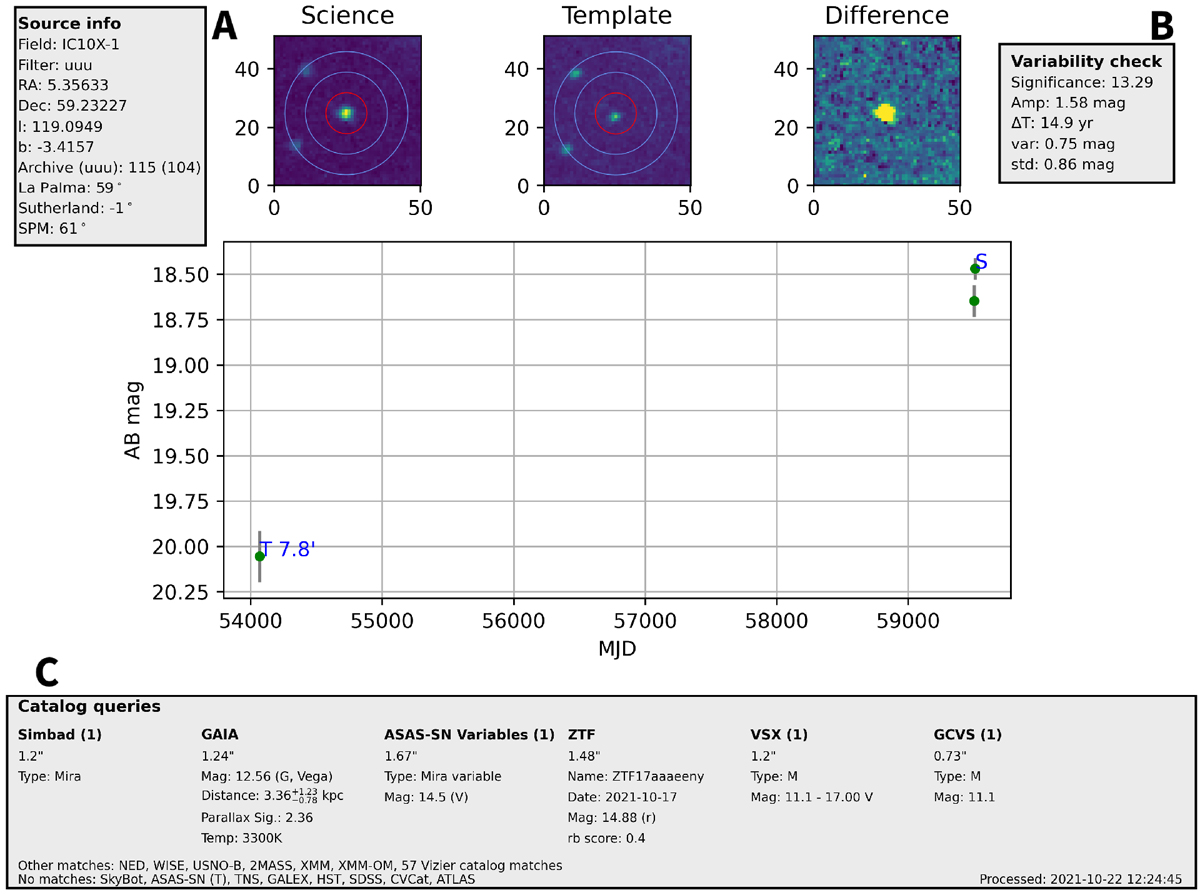
Output of PIV for a transient detected by TUVOpipe. The image stamps and light curve are produced by PIII (see Fig. 11 for an example). PIV supplements this with information about the UVOT observations (panel A), basic analysis of the light curve (panel B), and results from the catalogue queries performed (panel C). The information displayed in panels A, B, and C is discussed in detail in Sects. 3.5.1, 3.5.2, and 3.5.3, respectively. In this example, with all the information provided we can deduce a fairly robust classification of this source as a Mira variable (FQ Cas), based primarily on Simbad, ASAS-SN, VSX, and GCVS. Note that for most catalogues, magnitudes are provided in the AB system; where this is not the case (e.g. Gaia), we specify that the magnitude stated is in the Vega system.
Current usage metrics show cumulative count of Article Views (full-text article views including HTML views, PDF and ePub downloads, according to the available data) and Abstracts Views on Vision4Press platform.
Data correspond to usage on the plateform after 2015. The current usage metrics is available 48-96 hours after online publication and is updated daily on week days.
Initial download of the metrics may take a while.