Fig. 11
Download original image
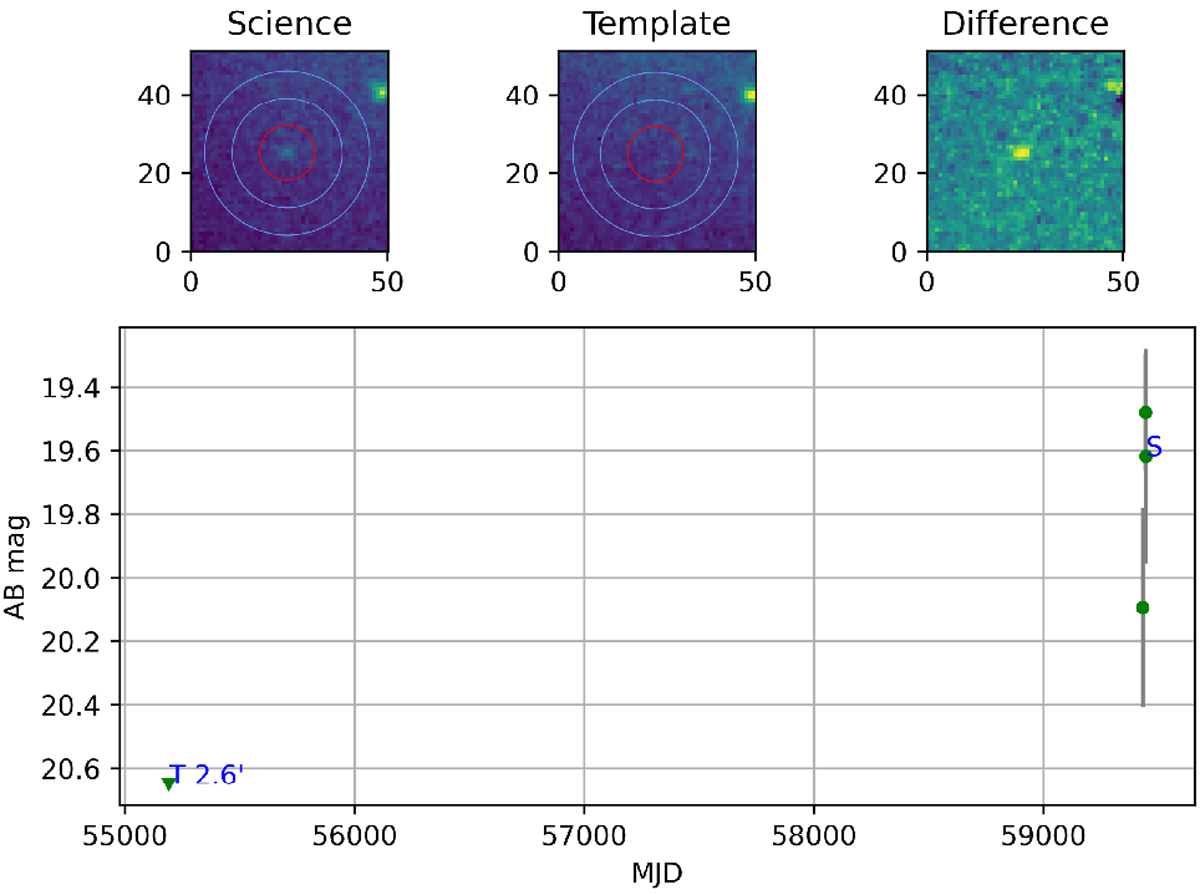
Example of final product of PIII for a candidate transient. Top row shows, from left to right, the (50″ × 50″) stamps of the source in one of the science images, the template image, and the difference image. The figure at the bottom shows the light curve created from the locally available QL data of the source (plus the upper limit of the source in the template image). In the left and middle stamps in the top row, the red circle indicates the source region and the blue annulus indicates the background region used by uvotsource. The data points in the light curve corresponding to the template and science images are indicated with a ‘T’ and an ‘S’, respectively. The value alongside the template label indicates the on-sky distance (in arcminutes) of the source in the template image from the centre of the template image. Inspection of the science, template, and difference image stamps clearly show that this is a real transient source. The data point derived at the source location in the template image is an upper limit, since there was no clear detection. The transient was found at RA = 00:42:46.65, Dec = +41:14:26.6 in the UVW1 filter and is a known nova in M31 (AT2021jwr).
Current usage metrics show cumulative count of Article Views (full-text article views including HTML views, PDF and ePub downloads, according to the available data) and Abstracts Views on Vision4Press platform.
Data correspond to usage on the plateform after 2015. The current usage metrics is available 48-96 hours after online publication and is updated daily on week days.
Initial download of the metrics may take a while.