Fig. 10
Download original image
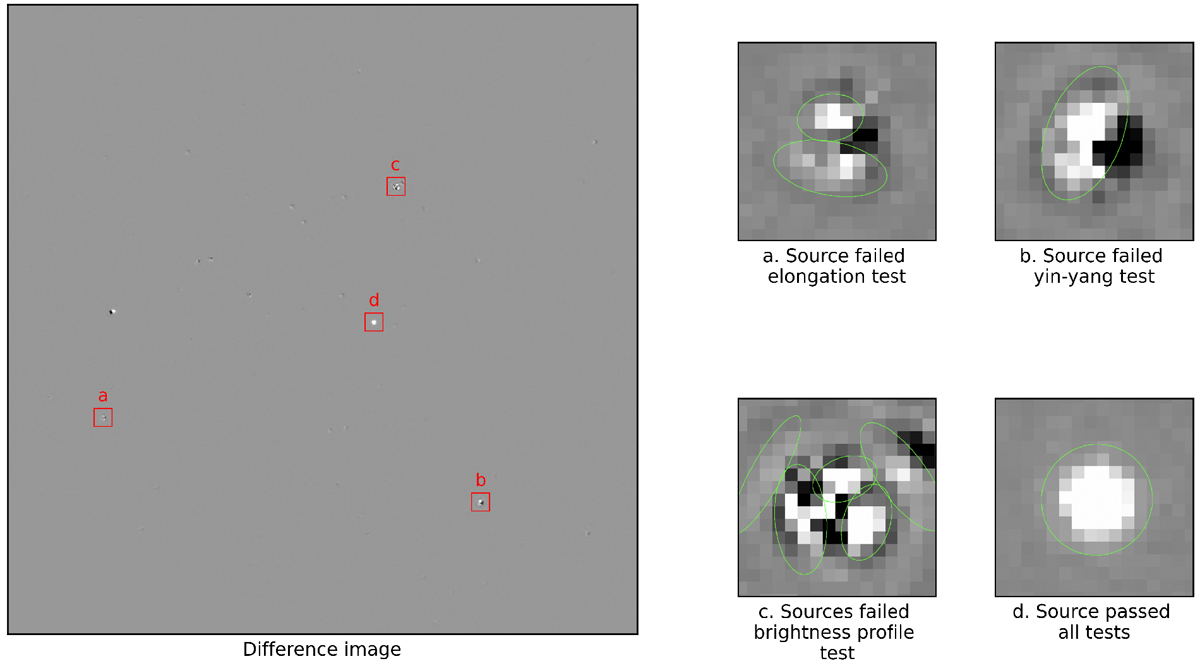
Example of a difference image and the outcome of our candidacy tests for some examples of the detected sources. Left panel: Typical difference image produced by TUVOpipe (science image: ObsID 00034748064, extension 2, u filter; template image: ObsID 00035028027, extension 1, u filter). In this difference image, 38 sources were detected. Only one passed all three tests (Sect. 3.3.3) and was retained as a candidate transient (source d – this is a real transient, the BL Lac prototype system, which is often monitored by Swift). The labels indicate the example sources displayed in the right panel. Right panel: examples of candidate transients detected in the difference image that did not pass one of the tests (a−c), and the only source that passed all tests (d). The elliptical regions are the source regions extracted by the source detection software (in this case uvotdetect).
Current usage metrics show cumulative count of Article Views (full-text article views including HTML views, PDF and ePub downloads, according to the available data) and Abstracts Views on Vision4Press platform.
Data correspond to usage on the plateform after 2015. The current usage metrics is available 48-96 hours after online publication and is updated daily on week days.
Initial download of the metrics may take a while.