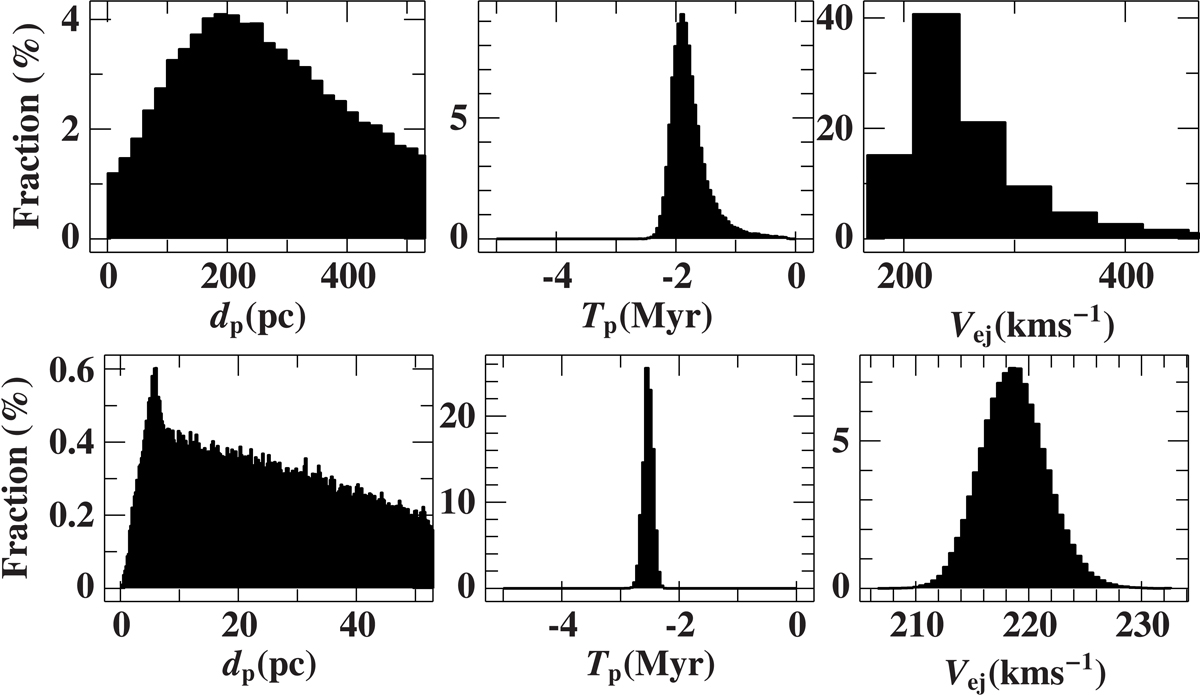
Fig. 2.
Download original image
Histograms for back-traced orbits of AE Aurigae and μ Col from Monte Carlo simulations. with HIPPARCOS second reduction (top) and Gaia EDR3 data (bottom). The left most panel shows the fraction of distances of closest encounters between the two stars. The middle panel is the histogram of the times for the closest encounters of the two stars, and the right most panel plots the relative velocity of the stars with respect to each other.
Current usage metrics show cumulative count of Article Views (full-text article views including HTML views, PDF and ePub downloads, according to the available data) and Abstracts Views on Vision4Press platform.
Data correspond to usage on the plateform after 2015. The current usage metrics is available 48-96 hours after online publication and is updated daily on week days.
Initial download of the metrics may take a while.