Open Access
Fig. 8
Download original image
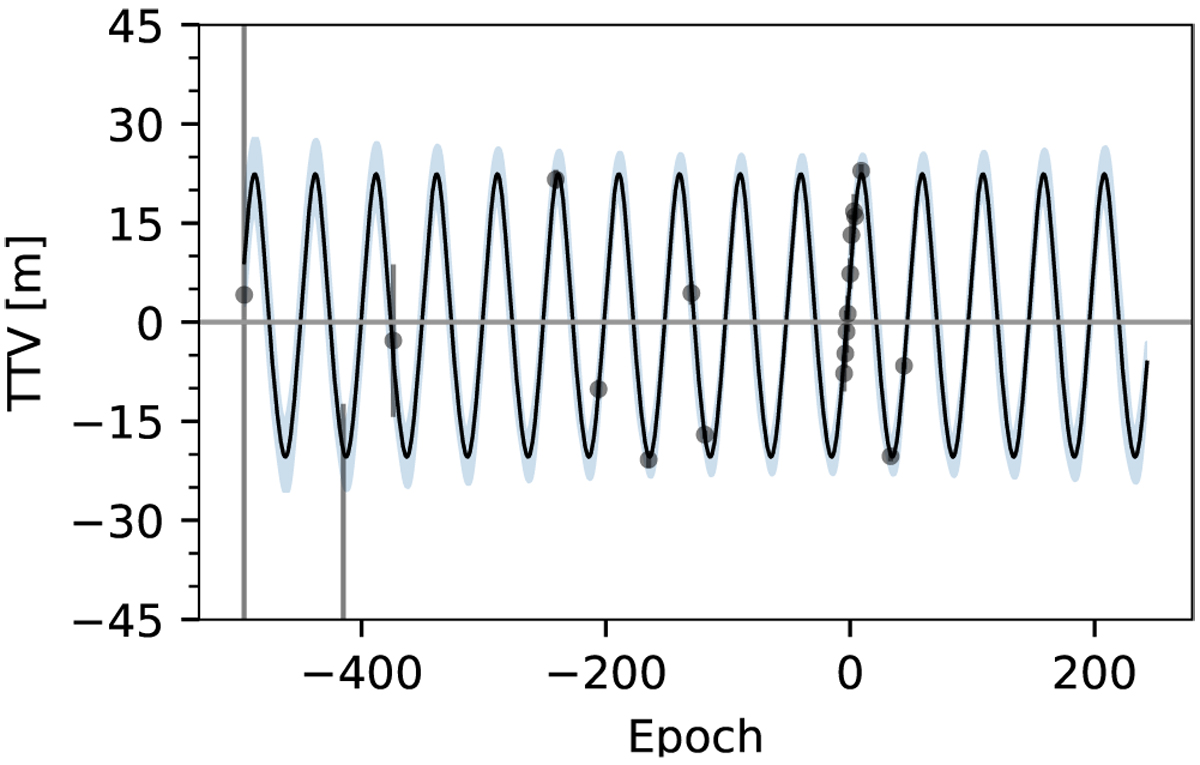
Model-independent analysis of the timings of the observed transits (black circles). The black line is the mean prediction of the posterior GP model, and the blue band is the 68.3% credible interval.
Current usage metrics show cumulative count of Article Views (full-text article views including HTML views, PDF and ePub downloads, according to the available data) and Abstracts Views on Vision4Press platform.
Data correspond to usage on the plateform after 2015. The current usage metrics is available 48-96 hours after online publication and is updated daily on week days.
Initial download of the metrics may take a while.