Fig. 7
Download original image
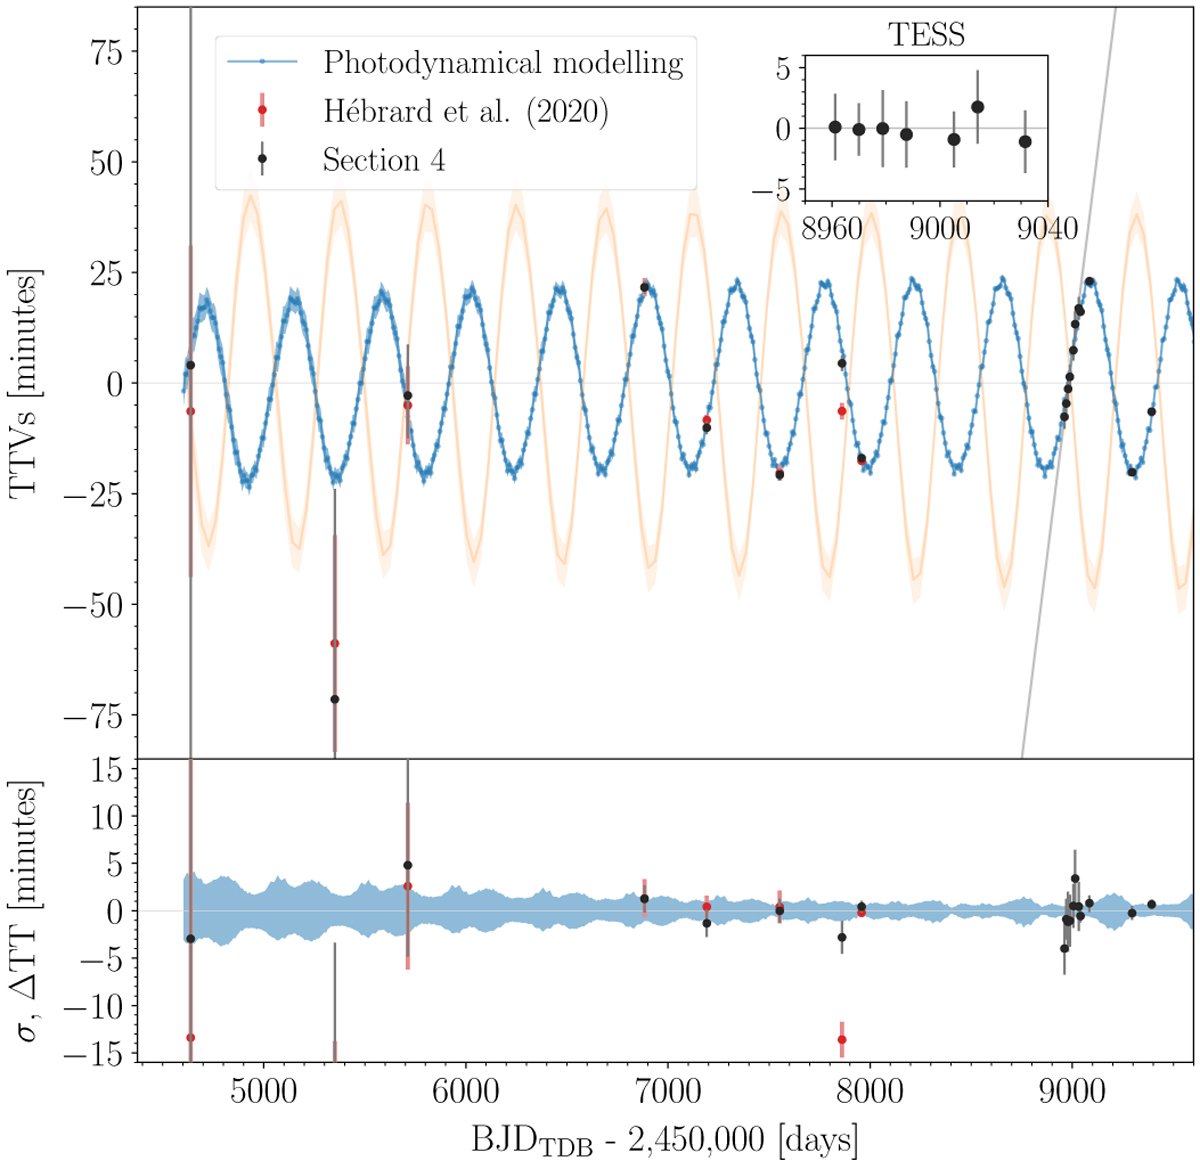
Posterior TTV predictions of planet b computed relative to a linear ephemeris6 are shown in blue. A thousand random draws from the posterior distribution were used to estimate the TTV median value and its uncertainty (68.3% credible interval). In the upper panel, the median TTV values are shown and compared with individual transit-time determinations (Hébrard et al. 2020 in red, and Sect. 5 in black). The thick grey line represents a linear ephemeris computed using only the transits observed by TESS (whose residuals are shown in the small panel in the upper right). In the lower panel, the posterior median transit-timing value was subtracted to visualise the uncertainty of the distribution. The posterior median transit time was also subtracted from each observed epoch for the individual transit-time determinations to allow for better comparison with the photodynamical modelling. The orange curve in the upper panel represents the variation in the times of inferior conjunction for planet c.
Current usage metrics show cumulative count of Article Views (full-text article views including HTML views, PDF and ePub downloads, according to the available data) and Abstracts Views on Vision4Press platform.
Data correspond to usage on the plateform after 2015. The current usage metrics is available 48-96 hours after online publication and is updated daily on week days.
Initial download of the metrics may take a while.