Fig. 3
Download original image
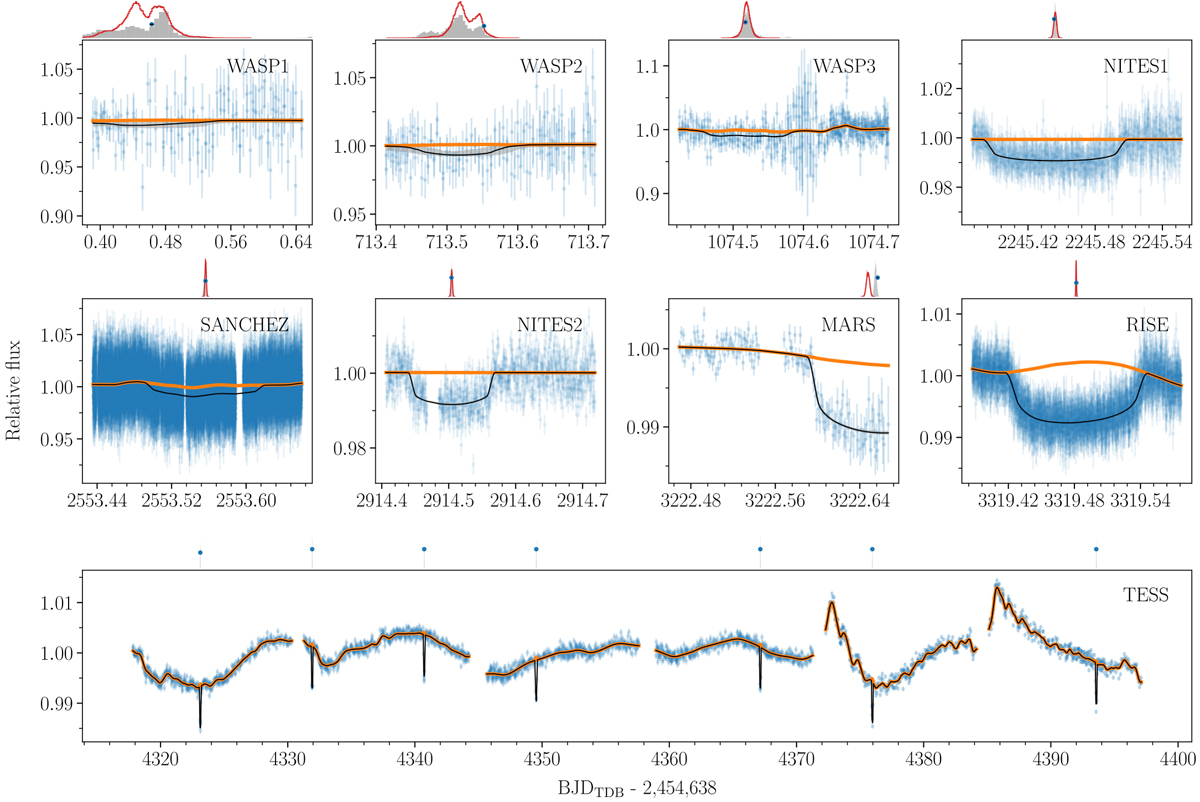
Modelling of the planet b transits presented in Hébrard et al. (2020) and observed by TESS (blue error bars). Each panel is labelled with the observatory or instrument name and sequential night of observation if there were more than one. Black lines and intervals in grey show the model median and 68.3% credible interval computed with 1000 random samples of the posterior. The mean of the predictive distribution of the kernel model is shown in orange. On top of each panel, the transit-timing posterior is shown for Hébrard et al. (2020) (red line histogram), the modelling with juliet (Sect. 5, grey histogram), and the photodynamical modelling (blue points with black error bars, although the errors are barely visible).
Current usage metrics show cumulative count of Article Views (full-text article views including HTML views, PDF and ePub downloads, according to the available data) and Abstracts Views on Vision4Press platform.
Data correspond to usage on the plateform after 2015. The current usage metrics is available 48-96 hours after online publication and is updated daily on week days.
Initial download of the metrics may take a while.