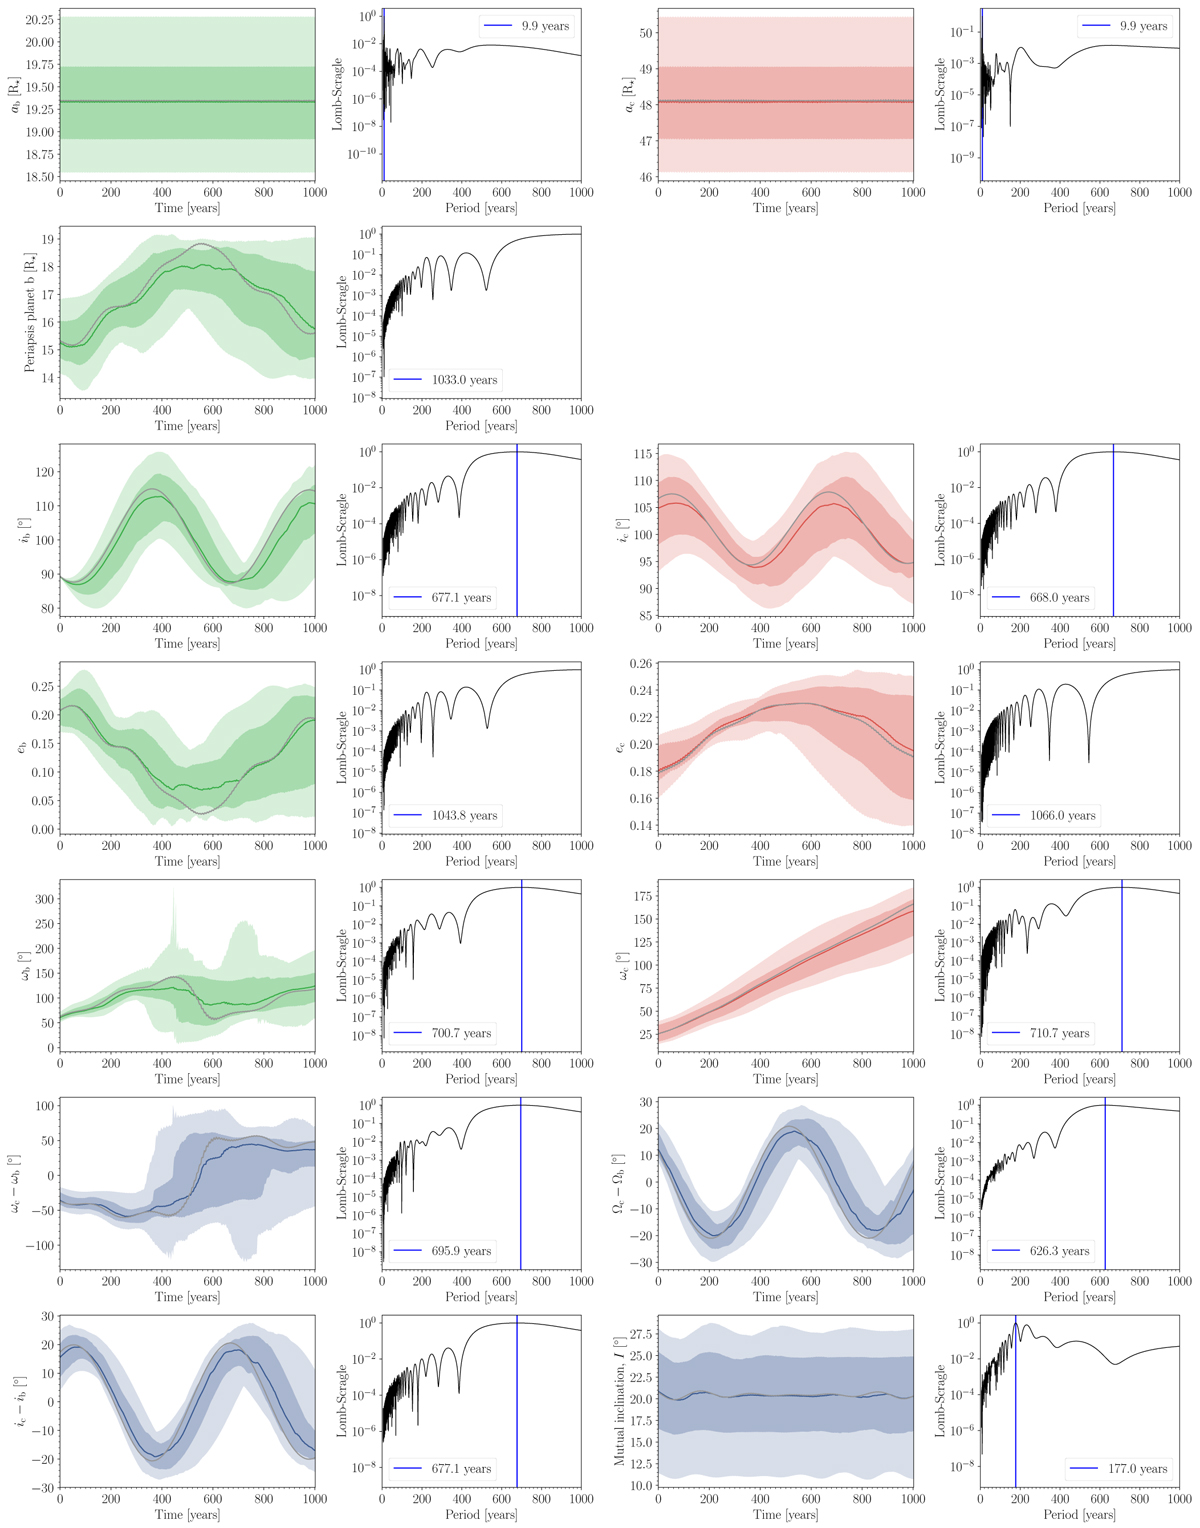
Fig. A.6
Download original image
Integrations over 1 kyr since the RISE transit from 1000 stable samples of the photodynamical modelling posterior. The 68.3% and 95.4% Bayesian CIs are plotted in different intensities. The solid colour curve marks the median of the posterior distribution. The solid grey curves correspond to the simulation based on the stable MAP values. The Lomb-Scargle periodogram of the median curve is shown, and the position of the most prominent peak is annotated.
Current usage metrics show cumulative count of Article Views (full-text article views including HTML views, PDF and ePub downloads, according to the available data) and Abstracts Views on Vision4Press platform.
Data correspond to usage on the plateform after 2015. The current usage metrics is available 48-96 hours after online publication and is updated daily on week days.
Initial download of the metrics may take a while.