Fig. A.5
Download original image
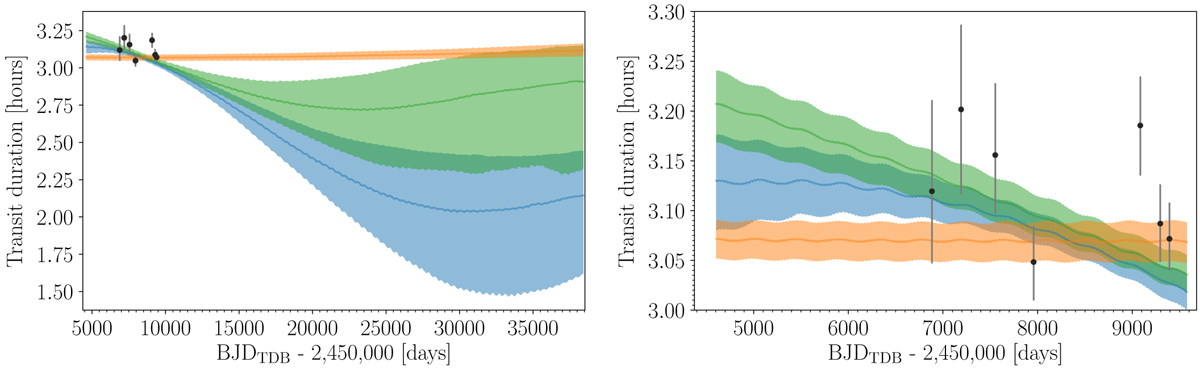
Comparison of transit duration variations for different models. Left: Posterior transit duration variations of planet b up to the end of the year 2100 from 1,000 random draws from the posterior distribution of the two-planet photodynamical modelling (Section 6), three-planet photodynamical modelling (Section 7.8), and coplanar two-planet photodynamical modelling (Section 7.3). The colours correspond with the ones used in Figure A.4. The points with error bars are the durations measured on individual transits (Section 7.3). Right: Zoom of the plot on the left.
Current usage metrics show cumulative count of Article Views (full-text article views including HTML views, PDF and ePub downloads, according to the available data) and Abstracts Views on Vision4Press platform.
Data correspond to usage on the plateform after 2015. The current usage metrics is available 48-96 hours after online publication and is updated daily on week days.
Initial download of the metrics may take a while.