Fig. A.2
Download original image
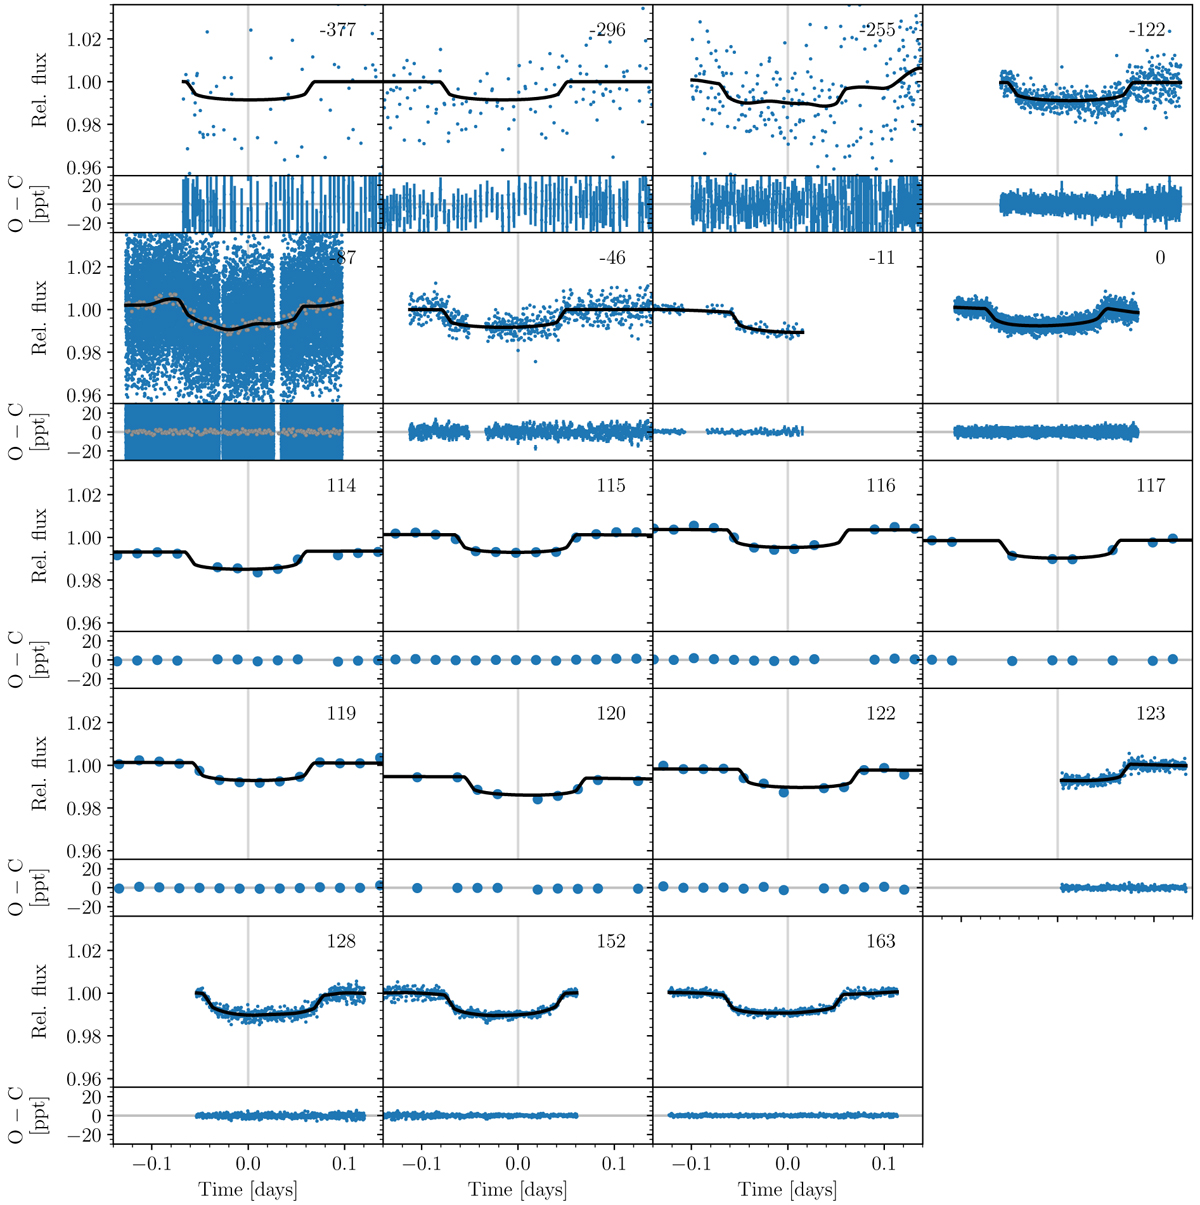
Transits of WASP-148 b (blue points) and the MAP model (black line) from the photodynamical modelling (Section 6). Each panel is centred at the linear ephemeris (indicated by the vertical grey lines, and reported in the caption of Fig. 7). For the SANCHEZ transit, 90-second binned data are shown in grey in addition to the observed data points. Each panel is labelled with the epoch; zero is the transit at tref. In the lower part of each panel, the residuals after subtracting the MAP model are shown.
Current usage metrics show cumulative count of Article Views (full-text article views including HTML views, PDF and ePub downloads, according to the available data) and Abstracts Views on Vision4Press platform.
Data correspond to usage on the plateform after 2015. The current usage metrics is available 48-96 hours after online publication and is updated daily on week days.
Initial download of the metrics may take a while.