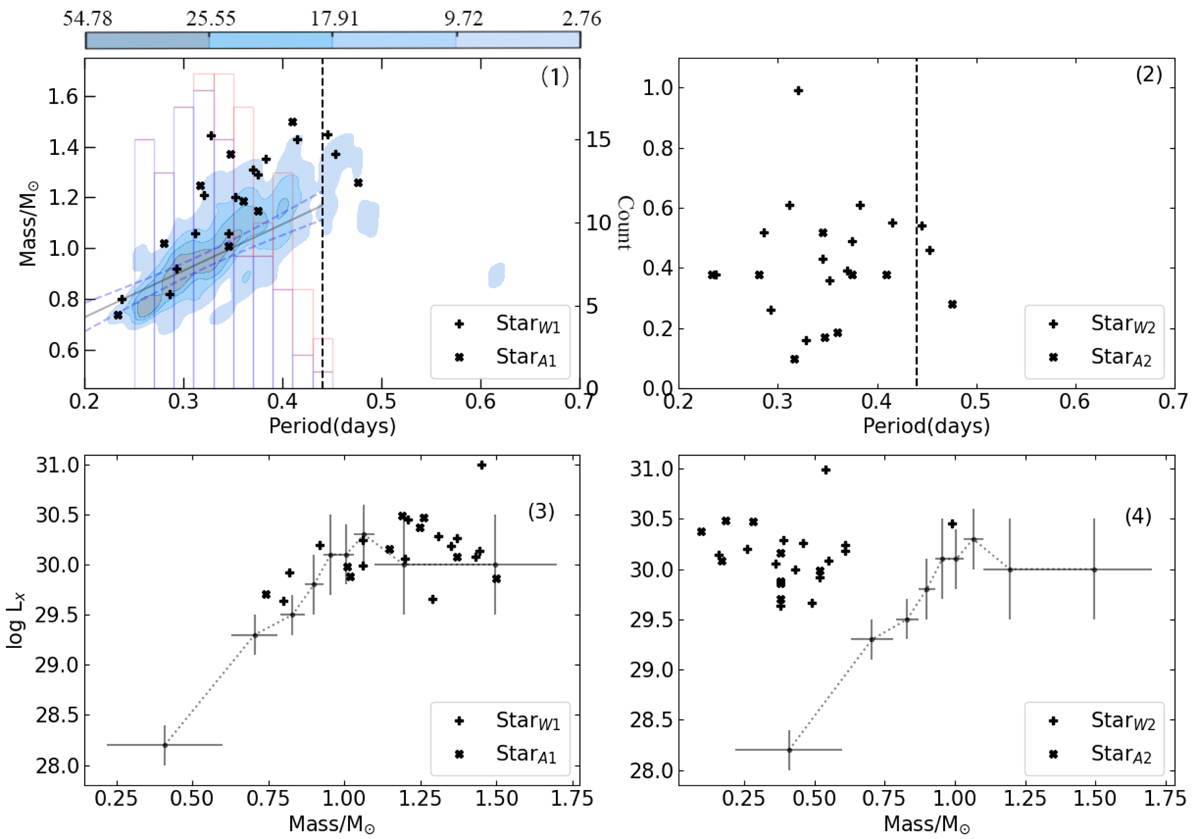
Fig. 7.
Download original image
Plots of the period vs. stellar mass for primary (1) and secondary (2) from sub-SRASS, and the mass of primary (3) and secondary (4) vs. log LX. The black dashed line in panels (1) and (2) is at 0.44 days. The small black points with dashed line in panels (3) and (4) indicate the X-ray luminosity of the main sequence star at saturation in the mass range (0.22–1.7 M⊙). In panel (1), the blue contours contain the data points from the 10 000 simulated samples (see text) with masses corresponding to the spectral temperatures from Spec-EWX (extra adding 0−200 K random errors of uniform distribution for each object) against the period, while the gray line and light blue dashed lines are the best-fit relation of these points with periods of ≤0.44 days and its 95% uncertainty range. The blue and red histograms (with 0.02-day steps) with axis on the right represent the period distributions of the primary stars with masses less than 1.1 M⊙ and greater than 1.1 M⊙, respectively (the average value of 10 000 simulations).
Current usage metrics show cumulative count of Article Views (full-text article views including HTML views, PDF and ePub downloads, according to the available data) and Abstracts Views on Vision4Press platform.
Data correspond to usage on the plateform after 2015. The current usage metrics is available 48-96 hours after online publication and is updated daily on week days.
Initial download of the metrics may take a while.