Fig. 6.
Download original image
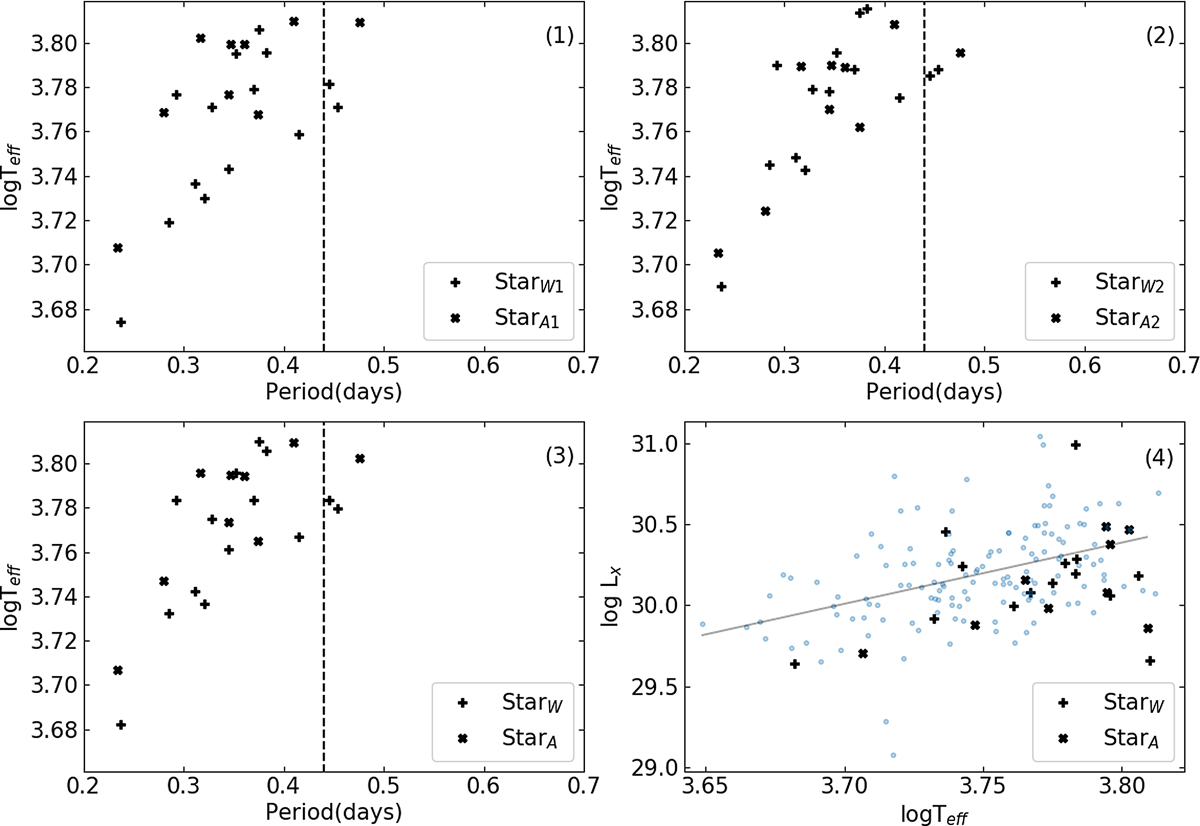
Plots of the period vs. log T for primary stars (1), secondary stars (2), and the binary systems (3) of the W-subtype (‘+’ symbols) and A-subtype (‘×’ symbols) from sub-SRASS. (4): Plot of log T vs. log LX. The dashed lines are at P = 0.44 days. The light blue points and gray line in the background of panel (4) are the Spec-EWX sample points and its fitting line from Fig. 5 (1 and 2).
Current usage metrics show cumulative count of Article Views (full-text article views including HTML views, PDF and ePub downloads, according to the available data) and Abstracts Views on Vision4Press platform.
Data correspond to usage on the plateform after 2015. The current usage metrics is available 48-96 hours after online publication and is updated daily on week days.
Initial download of the metrics may take a while.