Fig. 2.
Download original image
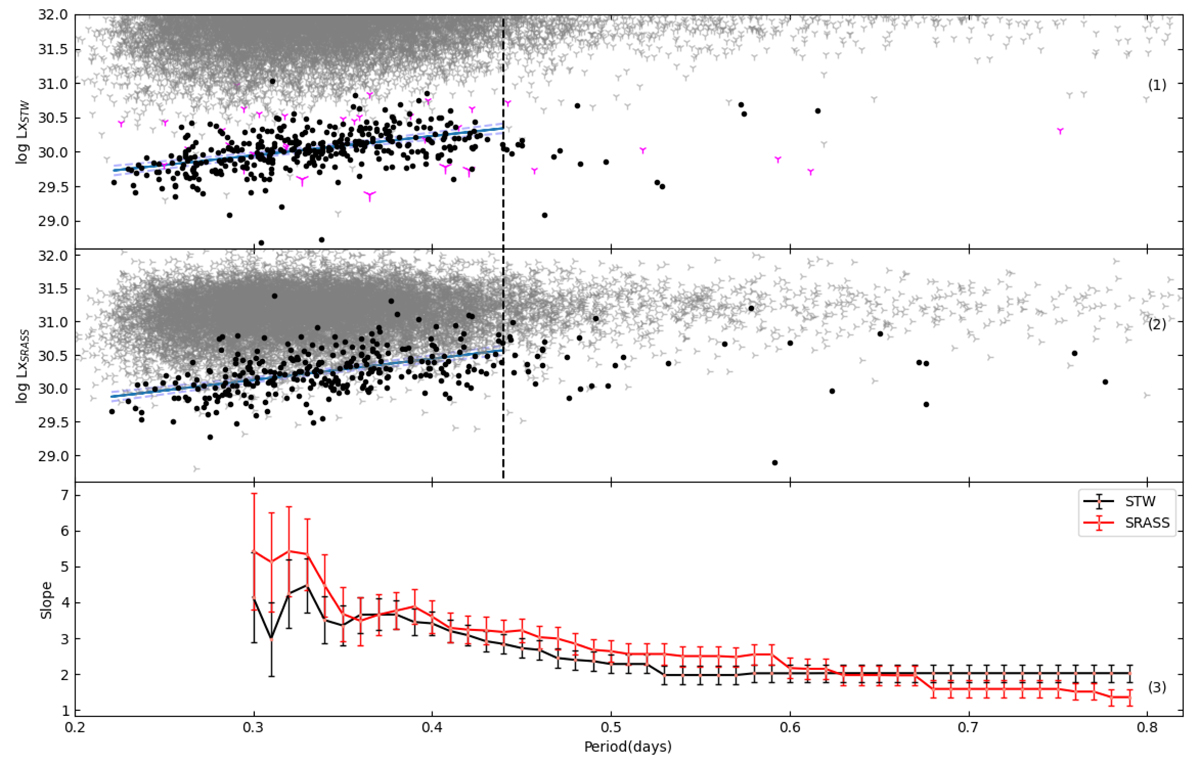
Orbital period vs. log LX: for STW (1) shown as black points. The magenta and gray ‘tri_down’ symbols represent the X-ray upper limits for some EW-type binaries from XMM-Newton pointed and slew survey, respectively; for SRASS (2) shown in black points. The gray ‘tri_right’ symbols represent the X-ray upper limits for some EW-type binaries from ROSAT survey. The period vs. slopes with their corresponding error bars of STW (black) and SRASS (red) with different limiting period ranges (3). The black dashed lines are at P = 0.44 days. The solid blue lines stand for best-fit linear correlations, and the light blue dashed lines represent 95% uncertainty ranges.
Current usage metrics show cumulative count of Article Views (full-text article views including HTML views, PDF and ePub downloads, according to the available data) and Abstracts Views on Vision4Press platform.
Data correspond to usage on the plateform after 2015. The current usage metrics is available 48-96 hours after online publication and is updated daily on week days.
Initial download of the metrics may take a while.