Fig. 9
Download original image
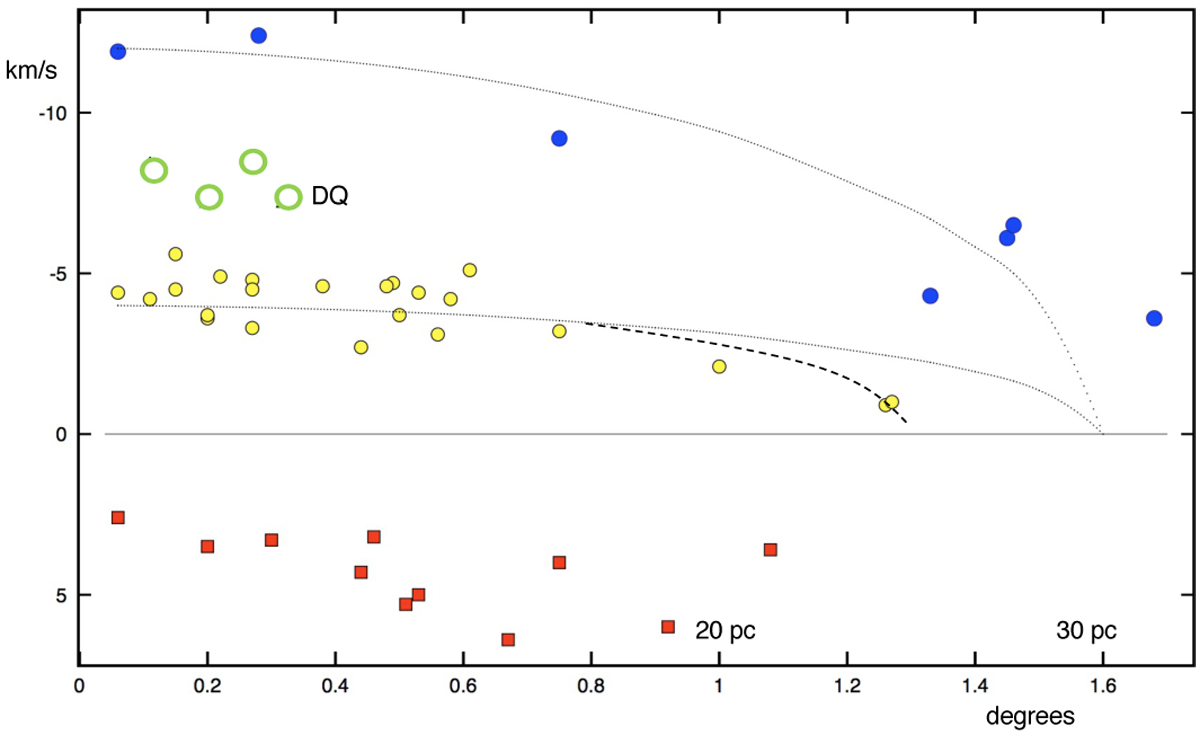
Radial velocities relative to the cluster velocity for different sub-areas against angular distance from the centre (in all directions). Blue dots mark areas that are expanding at high velocity, vexp ≈12 km s−1, and yellow circles (smaller) areas expanding at moderate speed, vexp ≈ 4 km s−1, when assuming spherically expanding systems (dotted curves). Green circles mark areas with intermediate velocities (‘DQ’ is the Dancing Queen). Red squares show areas with components whose velocities are redshifted relative to the cluster.
Current usage metrics show cumulative count of Article Views (full-text article views including HTML views, PDF and ePub downloads, according to the available data) and Abstracts Views on Vision4Press platform.
Data correspond to usage on the plateform after 2015. The current usage metrics is available 48-96 hours after online publication and is updated daily on week days.
Initial download of the metrics may take a while.