Fig. 14
Download original image
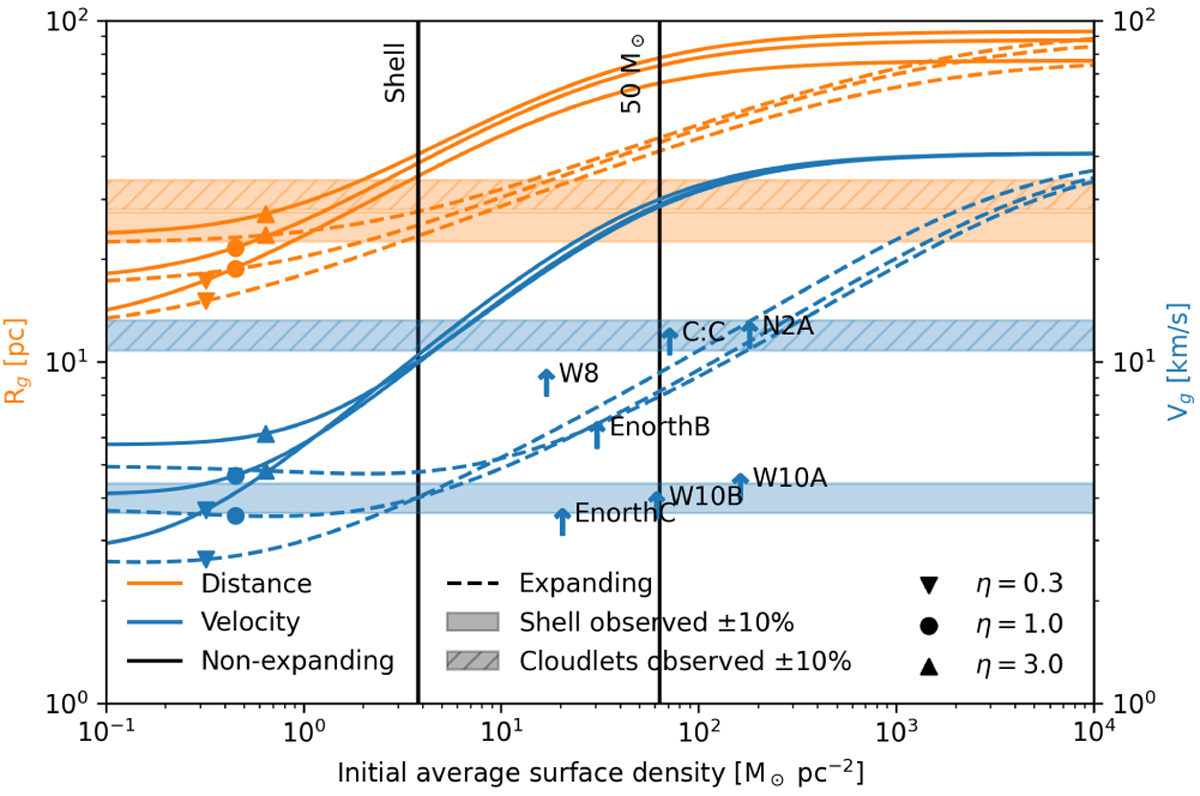
Distance to the centre of the complex (orange) and velocity (blue) of cloudlets as a function of initial average surface density, after evolution to 1.9, 2.17, and 2.3 Myr (for η = 0.3, 1, and 3, respectively). Solid lines represent cloudlets that do not expand as they travel, i.e. bound structures. Dashed lines represent cloudlets that expand with the shell, with their cross-sections growing with the distance squared, i.e. features on the shell that grow with it. Symbols overplotted on these lines indicate the stellar wind efficiency η. The hatched shaded regions denote 31 pc and 12 km s−1, the radius and velocity of the high velocity component of S 171, and the clear shaded regions denote 25 pc and 4 km s−1, the radius and velocity of the moderate velocity component. All observed values are shown with 10% errors. The surface densities and line-of-sight velocities (with respect to the cluster centre) of the cloudlets in Table 5 are shown as upward blue arrows. This velocity is a lower limit of their expansion velocity. The initial conditions were taken from the simulation snapshot at 0.22, 0.23, and 0.25 Myr (again for η = 0.3, 1, and 3, respectively), which resulted in a bubble radius of 25 pc and a velocity of 4 km s−1 at the respective end time using the Lancaster model. The two vertical black lines denote the average surface density of the shell at 0.23 Myr (left) and the surface density at the core of a 50 M⊙ (and 0.5 pc) Plummer sphere cloudlet.
Current usage metrics show cumulative count of Article Views (full-text article views including HTML views, PDF and ePub downloads, according to the available data) and Abstracts Views on Vision4Press platform.
Data correspond to usage on the plateform after 2015. The current usage metrics is available 48-96 hours after online publication and is updated daily on week days.
Initial download of the metrics may take a while.