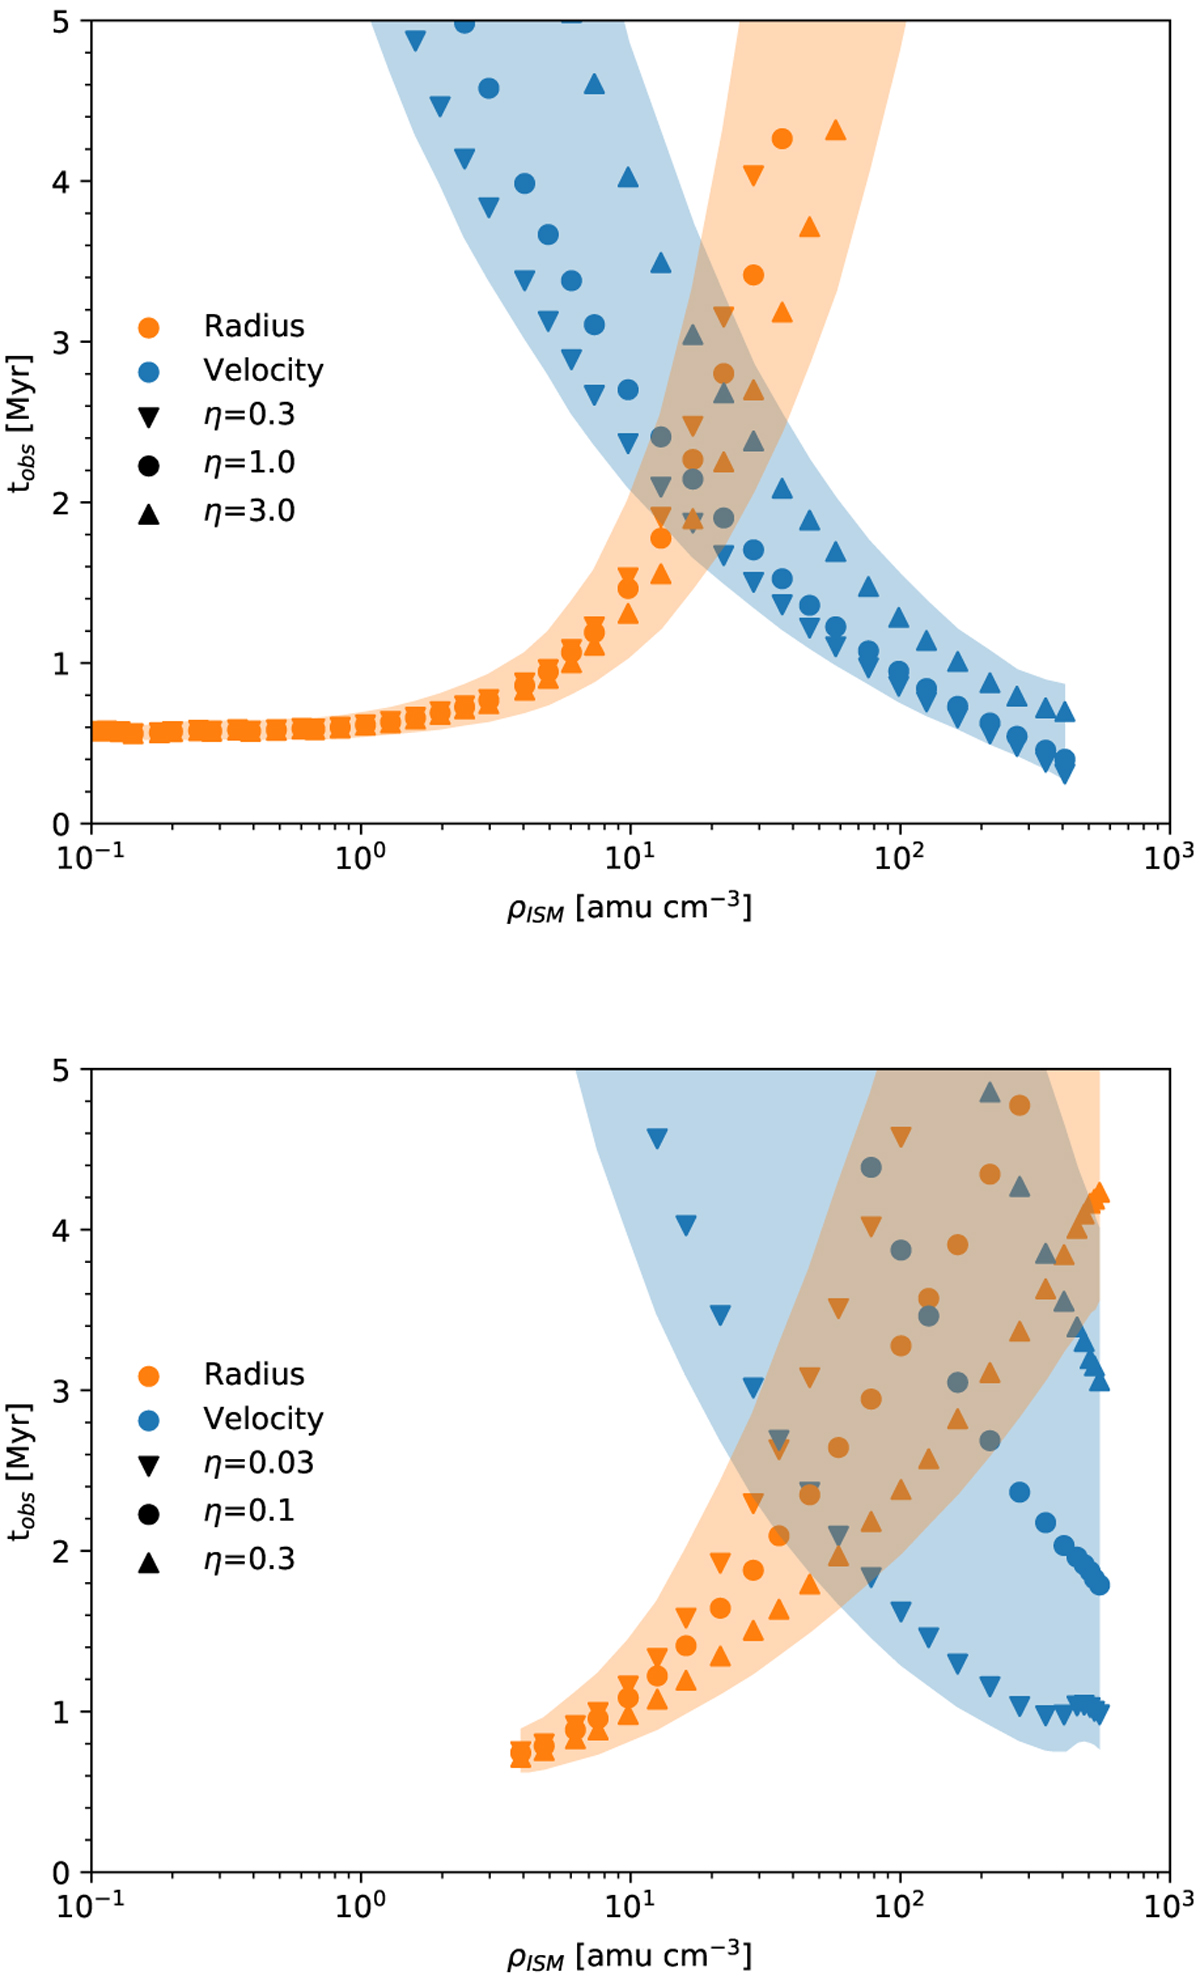
Fig. 13
Download original image
For a number of snapshots of the simulation, the density of a Plummer sphere at the shell position (assumed to be the ISM density) versus the moment at which in the numerical integration a shell velocity of 4 km s−1 and a radius of 25 pc is reached. Different symbols denote different stellar wind efficiencies η. Shaded regions denote the envelope allowed for all efficiencies plotted and a 10% error in the observed velocity and radius. The top panel shows the results obtained using the Lancaster model, and the bottom panel shows the results from the Weaver model.
Current usage metrics show cumulative count of Article Views (full-text article views including HTML views, PDF and ePub downloads, according to the available data) and Abstracts Views on Vision4Press platform.
Data correspond to usage on the plateform after 2015. The current usage metrics is available 48-96 hours after online publication and is updated daily on week days.
Initial download of the metrics may take a while.